Understanding State Pension Systems
By Patrick Shaughnessy , Senior Budget Analyst | 5 years ago
Retirement/Pensions Analyst: Sean Brandon, Assistant Executive Director
Pennsylvania has two main public pension funds: the Public School Employees’ Retirement System (PSERS) and the State Employees’ Retirement System (SERS). These pension systems were established to provide a stable retirement income for public workers employed by Pennsylvania’s school districts and state government. For many years, pension contributions have been significant cost drivers in state and school districts budgets. However, despite their importance to commonwealth – in terms of the economic impact of the benefits paid to retirees as well as the payments required from public budgets – many people are unfamiliar with how the systems work. This primer will explain the basics of pension system operations and the particulars of PSERS and SERS finances.
|
|
PSERS
|
SERS
|
Combined
|
|
Established
|
1917
|
1923
|
-
|
|
Active Members
|
256k
|
103k
|
359k
|
|
Annuitants/Beneficiaries
|
237k
|
133k
|
370k
|
|
Assets
|
$59.1B
|
$30.9B
|
$89.1B
|
Statutory Basis
A number of different statutes control PSERS and SERS. The two most important are Title 24 and Title 71 of Pennsylvania’s consolidated statutes. Title 24 is the state education code. Part IV of this code specifically addresses PSERS and retirement provisions affecting teachers. Title 71 is the state government code, Part XXV of which addresses SERS and retirement provisions for state employees.
Pension system unfunded liabilities are debts that must be paid and are obligations of the commonwealth pursuant to 24 Pa.C.S. §8531 and 71 Pa.C.S. §5951.
In addition, there are many standalone statutes that deal with the pension systems. Several of the most important such acts are described elsewhere in this document.
MANAGEMENT AND GOVERNANCE
PSERS and SERS are both quasi-independent state agencies headed by an executive director. Each of the systems is overseen and governed by a board of trustees comprised of various stakeholders to the fund. Some trustees are either elected or appointed to the boards, while others are ex officio members whose place on the board is tied to holding another position.
PSERS’ board of trustees has fifteen members. There are four ex officio members: the Secretary of Education, the Secretary of Banking and Securities, the State Treasurer, and the executive director of the Pennsylvania School Board Association. There are four appointees from the legislature, with members from the majority and minority caucuses of the Senate and from the majority and minority caucuses of the House of Representatives. The governor also appoints one member to the board. Finally, there are five members elected to the board: three from among current active teachers, one from among current active employees other than teachers, one from among current annuitants, and one member of a school board.
SERS has an eleven-member board of trustees. There are two ex officio members: the State Treasurer and the Secretary of Banking and Securities. There are four legislative appointees, with members from the majority and minority caucuses of both the Senate and the House of Representatives. Finally, there are five members appointed by the governor. SERS requires that one trustee be a retired member of the plan, that at least five members must be currently contributing members of the plan, and that at least two members must have at least ten years of service with a SERS-participating employer.
PENSION BENEFITS
Pension benefits are calculated by a formula that takes into account an employee’s salary and years of service. Changes to this formula are frequent components of the pension reform bills that have been considered or passed over the years.

Annual Accrual Rate
The annual accrual rate, often referred to as the pension multiplier, is represented as a percentage and reflects the accrual of benefits over time. For each year of credited service under one of the pension systems, an employee receives a certain percentage of his or her final salary as a retirement benefit.
Years of Credited Service
The years of credited service generally equates to total number of years an employee has worked for a state agency or school district. However, there are some exceptions, such as when an employee purchases credited service for things like time served in the military.
Final Salary
The final salary used to calculate benefits is actually not an employee’s salary in his or her final year of employment. Instead, the final salary is the average of the highest five years of salary that an employee earned during their career with the state or a school district.
Maximum Annual Retirement Allowance
The maximum annual retirement allowance is the highest possible annual pension benefit that an employee may earn based on the calculation above. However, the actual benefit an individual receives may be reduced if they retire before attaining superannuation – either by working a certain number of years, reaching a certain age, or a combination thereof. Like other pension benefit factors, the exact rules for superannuation vary depending on employee classification.
Multiple Service
Some individuals may be members of PSERS and SERS if at different times they held jobs covered by different systems. These employees may choose whether to combine their service into a single pension under one of the system or receive separate pension from the two systems.
Purchasing Service
The retirement codes allow for employees to purchase additional years of credited service in certain circumstances. One such example is covered military service. Active employees may choose to pay the contributions that would have been due for those years of service, had they been ordinary PSERS or SERS years of credited service. Those purchased years of service will then count towards the total years of service of the employee.
Alternative Benefit Formulas
Some particular classes of employees - such as legislators, judges and state police - have unique benefit formulas that do not conform to the broader classes which include most employees. For example, the DiLauro Award is a benefit structure specifically for state police which allows earlier retirement with full benefits in recognition of the unique aspects of the job.
Vesting
Before an employee is entitled to the benefit of employer contributions to his or her pension, the employee must work a certain minimum number of years. This is referred to as the vesting period. If an employee leaves state or school district service prior to being vested, they are only entitled to collect the employee contributions deducted from their paychecks. As of Act 120 of 2010, the vesting period for new teachers and state employees is ten years.
Mature Pension Systems
A pension system is considered mature if it has more annuitants collecting benefits than active members contributing into the system. Mature pension systems face different challenges than immature systems as they often experience negative cash flow – meaning that more money is being paid out in benefits than is being collected in contributions. PSERS has more active members than annuitants, while SERS currently has more annuitants than active members.
Defined Benefit vs. Defined Contribution
In a defined benefit plan, an employee is promised a certain post-retirement income based on a number of factors such as years of service and final salary. Providing promised benefits becomes a financial obligation of the employer or plan sponsor, irrespective of external factors such as investment performance.
In a defined contribution plan, the employer pledges to make set contributions to an individual retirement account for each employee. Post-retirement income is then based solely on the size of an employee’s account at the time of retirement with no ongoing financial obligation from the employer.
For much of the twentieth century, retirement plans in both the public and private sectors were structured as defined benefit plans. Over the last several decades, however, more and more private sector companies began switching to defined contribution plans instead. Even more recently, some public sector entities have begun offering defined contribution plans rather than defined benefit plans.
Act 5 of 2017 established a defined contribution component for Pennsylvania’s teachers and public employees for the first time. New employees under Act 5 must make a one-time selection when they are hired between three different pension plans: two different hybrid plans which include both defined benefit and defined contribution components, and one entirely defined contribution plan.
Over time, the General Assembly has made changes to how these various components are accrued or weighted. These changes are always forward looking, meaning that current employees already participating in one of the pension systems are unaffected. As a result, there are a number of different classes of employees at each system, which have slightly different values in their benefit calculations.
|
|
Employee Contribution
|
DB Multiplier
|
Employer DC Contribution
|
Vesting
|
|
Act 9
|
6.25%
|
2.50%
|
-
|
5 years
|
|
Act 120
|
6.25%
|
2.00%
|
-
|
10 years
|
|
Act 5 Hybrid (default)
|
8.25%
|
1.25%
|
2.25%
|
DB - 10 years
DC - 3 years
|
|
Act 5 Hybrid (option)
|
7.50%
|
1.00%
|
2.00%
|
DB - 10 years
DC - 3 years
|
|
Act 5 DC
|
7.50%
|
-
|
2.00%
|
3 years
|
Pension Benefits and Pennsylvania’s Economy
Pension benefit payments are not only vital to the retirees receiving them, but are important contributors to Pennsylvania’s economy. In 2019, PSERS and SERS made benefit payments totaling $9.4 billion. Approximately 90 percent of those payments go to Pennsylvania residents, supporting businesses and jobs in local economies throughout the commonwealth. The chart below shows the total benefit payments made by PSERS and SERS to each county in Pennsylvania.
| County |
Benefit Payments (millions) |
County |
Benefit Payments (millions) |
County |
Benefit Payments (millions) |
| Adams |
$65.5 |
Elk |
$17.9 |
Montgomery |
$712.6 |
| Allegheny |
$764.4 |
Erie |
$187.3 |
Montour |
$20.2 |
| Armstrong |
$50.7 |
Fayette |
$136.9 |
Northampton |
$177.7 |
| Beaver |
$112.1 |
Forest |
$6.4 |
Northumberland |
$87.0 |
| Bedford |
$41.8 |
Franklin |
$84.0 |
Perry |
$72.3 |
| Berks |
$266.4 |
Fulton |
$13.0 |
Philadelphia |
$508.4 |
| Blair |
$118.8 |
Greene |
$32.0 |
Pike |
$16.1 |
| Bradford |
$38.2 |
Huntingdon |
$63.5 |
Potter |
$13.6 |
| Bucks |
$424.3 |
Indiana |
$104.8 |
Schuylkill |
$124.7 |
| Butler |
$158.6 |
Jefferson |
$41.2 |
Snyder |
$43.5 |
| Cambria |
$152.7 |
Juniata |
$43.5 |
Somerset |
$70.1 |
| Cameron |
$5.6 |
Lackawanna |
$180.9 |
Sullivan |
$6.8 |
| Carbon |
$43.7 |
Lancaster |
$356.6 |
Susquehanna |
$28.3 |
| Centre |
$228.1 |
Lawrence |
$86.6 |
Tioga |
$34.5 |
| Chester |
$368.4 |
Lebanon |
$106.4 |
Union |
$36.9 |
| Clarion |
$42.7 |
Lehigh |
$190.0 |
Venango |
$64.3 |
| Clearfield |
$76.6 |
Luzerne |
$259.2 |
Warren |
$38.7 |
| Clinton |
$42.2 |
Lycoming |
$112.4 |
Washington |
$195.2 |
| Columbia |
$70.2 |
McKean |
$29.0 |
Wayne |
$37.0 |
| Crawford |
$75.1 |
Mercer |
$101.0 |
Westmoreland |
$310.3 |
| Cumberland |
$341.1 |
Mifflin |
$35.7 |
Wyoming |
$29.7 |
| Dauphin |
$443.6 |
Monroe |
$66.3 |
York |
$257.1 |
| Delaware |
$351.3 |
|
|
|
|
PENSION FUNDING
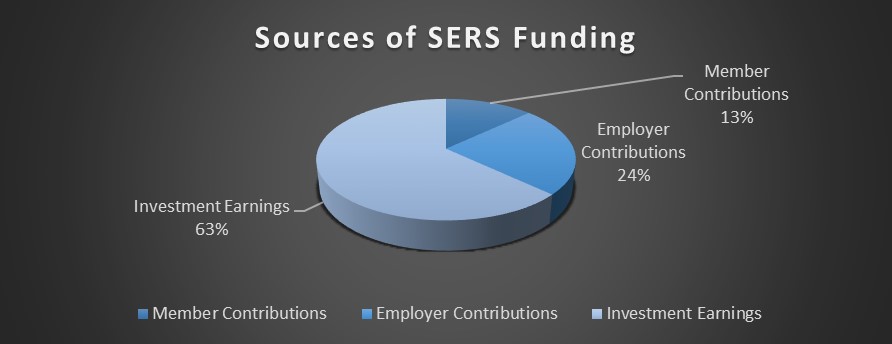
Pennsylvania’s public pension funds receive funding from three different sources: employee contributions, employer contributions, and investment returns.
Employee Contributions are a flat percentage deducted directly from the paychecks of state and school employees. These contribution rates vary depending on the type of employee and their employee class under the retirement code.
Employer Contributions fluctuate from year to year based on a number of different factors. Since employers are the ultimate guarantors of pension benefits, employer contributions must rise to cover any shortfalls in the actuarial position of the pension funds. For PSERS, employer contributions are split with approximately half coming from school districts and the other half coming from the commonwealth. In the case of SERS, the full employer contribution is paid by the agency that employees a member.
Investment Returns are the gains (or losses) on the assets of the systems. The systems invest in a variety of assets, including stocks, bonds, commodities, and real estate. Over the last twenty years, investment returns have contributed more than half of total funds for the pension systems.

A number of different factors determine the required contributions from employers in a given year.
Normal Cost
The normal cost for a pension system is the present value cost of providing the promised retirement benefits for current public employees. This is a fairly small component of the total employer cost in Pennsylvania – less than ten percent – since the largest share of employer contributions go towards eliminating the large unfunded liabilities of PSERS and SERS.
Actuarially Accrued Liability
The actuarially accrued liability refers to the present value of all benefits currently promised or accrued to system annuitants or active members. This is total amount of funding required to ensure that all benefits can be paid from the assets of the systems.
Assumed Rate of Return
One of the most important variables in pension funding is the assumed rate of return. The assumed rate serves multiple functions. First and foremost, this is the average annual return that the systems assume they will earn on their invested assets. While returns may fluctuate widely on a year-to-year basis, this average is used for long-term planning. The assumed rate of return is also the rate at which the unfunded liability grows since it is that return each dollar would be expected to generate if invested rather than being unfunded.
PSERS currently uses 7.25 percent for its assumed rate of return, while SERS uses 7.0 percent.
Actuarial Assumptions
The pension systems and their consultant actuaries use a number of different assumption when making future projections of liabilities. Among these are the assumed rate of return, the rate of wage growth for covered employees, and a number of demographic factors such as the average length of a career and the average number of years a retiree will collect benefits. Every five years, the systems are required to conduct an experience study examine the accuracy of these assumptions and make adjustments as necessary.
Amortization and Smoothing
Pension liabilities are long-term obligations. Consequently, they are valued and paid over long durations rather than on a short-term basis.
Investment gains and losses are smoothed by the pension systems in order to minimize sharp changes in employer contribution rates. For PSERS, that means that all investment gains or losses are realized over a ten-year period. For SERS, that smoothing period is five years.
Additionally, any upward or downward revisions to the actuarially accrued liability or to system assets are amortized over several years – twenty-four years for PSERS and thirty years for SERS.
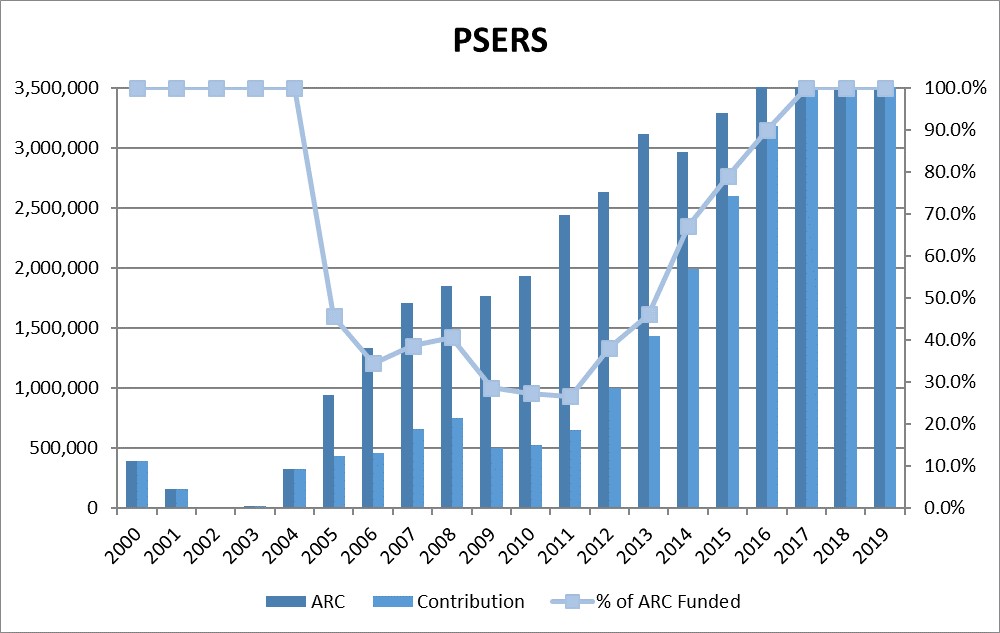
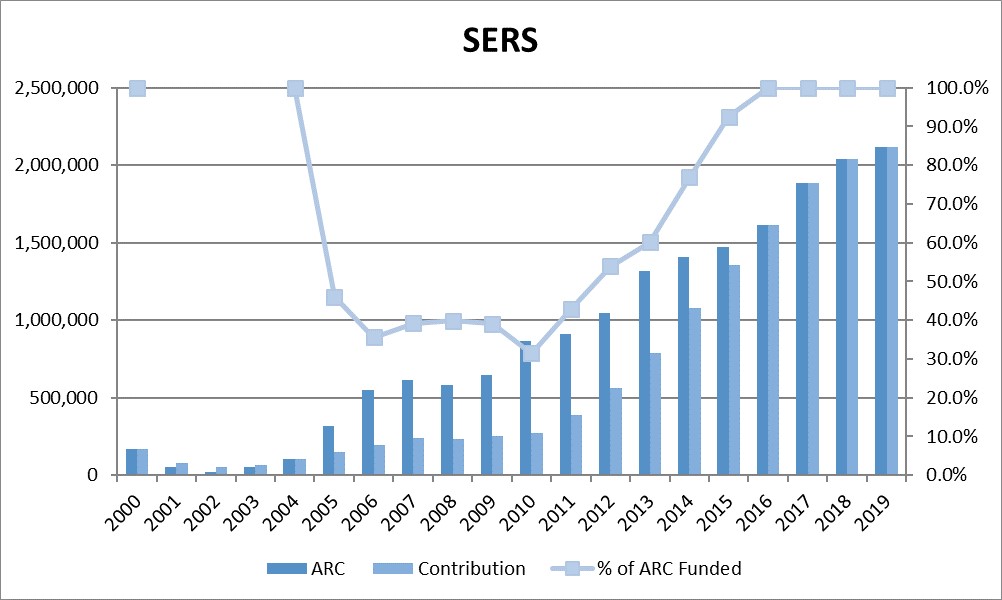
Actuarially Required Contribution
The actuarially required contribution, or ARC, is the employer contribution, which must be paid annually. This payment includes two major components: the normal cost and the unfunded liability cost. As discussed above, the normal cost is a relatively small component of the ARC for Pennsylvania’s pension systems. More than ninety percent of the ARC is attributable to the unfunded liability cost.
Unfunded Liabilities and Funded Ratios
An unfunded liability exists when a pension system has larger liabilities – which consist of the benefits owed to retirees and the future benefits owed to active members – than it has assets. This concept can also be expressed as a funded ratio, or the total assets of the system divided by its total liabilities. PSERS and SERS currently have significant unfunded liabilities and correspondingly low funded ratios. As of the most recent valuations, PSERS had an unfunded liability of $46.8 billion and a funded ratio of 56.5 percent, while SERS had an unfunded liability of $23.4 billion and a funded ratio of 56.1 percent. Generally, a public sector pension system is considered to be financially healthy if its funded ratio exceeds 80 percent.
Causes of Underfunding
There are three major causes for the underfunding of SERS and PSERS: investment underperformance, policy changes such as unfunded benefit increases, and employer contribution shortfalls.
Investment Underperformance
The last twenty years of investment performance have included two major downturns: the Dot Com Bust of the early 2000s and the 2008-09 Great Financial Crisis. Each of these downturns led to significant losses to pension systems. While these losses are smoothed and amortized as described above, they still caused significant reductions in the funded ratios of the systems. Approximately 40 percent of the unfunded liabilities of the systems are attributable to investment underperformance.
Unfunded Benefit Increases
Act 9 of 2001 provided an unfunded and retroactive benefit increase to PSERS and SERS members. The act increased the benefit multiplier for most employees from 2 percent to 2.5 percent. By increasing the total actuarially accrued liability of the systems without any corresponding increase in contributions to the systems, this act led to some of the deterioration in the funded ratios of the systems. These changes are responsible for approximately 15 percent of the unfunded liabilities.
Employer Contribution Shortfalls
The largest contribution to the unfunded liabilities of the two pension systems – nearly 45 percent – is systematic underfunding. Act 40 of 2003 and Act 120 of 2010 both established funding schedules that reduced employer contributions below the level of the ARC required to maintain adequate funding. These acts were successful in their goal of providing immediate budgetary relief to school districts at the commonwealth. However, those payments were merely deferred into the future. Furthermore, those deferred contributions continued to compile interest at the assumed rates of return of the systems, which significantly increased the eventual cost of those deferrals.
Fortunately, employers are once again making the full ARC payment to both PSERS and SERS. Unfortunately, the employer contribution rate is very high – between 30 and 35 percent for both systems – and will remain high for many years until school districts and the state have paid down their unfunded liabilities.
Major Pension Acts
Act 9 of 2001 increased the benefit multiplier for teachers and public employees. Certain classes of employees, such as judges or elected officials, have special benefit schedules. For most employees covered, however, the multiplier increased from 2.0 percent to 2.5 percent. Crucially, this benefit increase was both retroactive (applied to prior years of service) and unfunded (no funds were allocated to make the increase actuarially neutral to the pension systems). As a result, Act 9 is one of the main contributors to the unfunded liability.
Act 40 of 2003 partially deferred employer contributions from the commonwealth and school districts. The act provided immediate budgetary relief by reducing employer contributions. However, these deferrals added to the long-term liabilities of the systems since delayed payments accrued interest at the assumed rate of return of the systems.
Act 120 of 2010 was the first and largest piece of reform legislation meant to tackle the unfunded liabilities of SERS and PSERS. The act reduced the benefit multiplier for new employees, established a risk-sharing provision, and created rate collars to manage the increase in annual pension contributions by the state and school districts.
The rate collars imposed by Act 120 temporarily suppressed rising employer contributions to SERS and PSERS, allowing the state to more gradually increase its payments until it was making the full ARC payment. However, the consequence of these collars was to increase the unfunded liabilities of the system in the short term.
Risk Sharing
The risk sharing provision included in Act 120 requires that if investment returns fall below a certain level over a set period of time, then employee contributions will increase. This provision is meant to put some of the risk of poor investment performance on employees rather than solely on employers.
Act 5 of 2017 introduced a defined contribution component to Pennsylvania’s pension systems for the first time. New employees now have three options for a pension benefit: one which is a pure defined contribution plan and two hybrid plans that combined a defined contribution component with a traditional, but reduced, defined benefit component.
The act also created the Public Pension Management and Asset Investment Review Commission (PPMAIRC), a five-person commission tasked with identifying operational and fee savings at the pension systems.