The Pennsylvania Lottery and Lottery Fund
By Ronni Burkhart , Assistant Executive Director | 4 years ago
Lottery Analyst: Mara Perez, Senior Budget Analyst
Act 91 of 1971 established the Pennsylvania Lottery to generate funds for programs that benefit Pennsylvania’s elderly population. Proceeds from lottery operations are deposited into the Lottery Fund. Profits, after paying for lottery prizes and operating costs, fund programs benefitting seniors.
The Department of Revenue is responsible for administering and operating the Lottery. This includes the marketing and development of games, promoting sales, licensing agents to sell games, and validating winning tickets. Act 42 of 2017 authorized the department to expand lottery’s product line to include Keno and internet games. iLottery was launched in May 2018.
This primer reviews the games offered by the Pennsylvania Lottery and the programs supported by the Lottery Fund. It examines lottery revenues, expenses, and profits, and presents trends over the past ten years.
SOURCES OF LOTTERY REVENUE
The Pennsylvania Lottery offers a variety of games, with different styles of play, to appeal to a broad range of consumers. Price points, prizes, and odds of winning vary by game. Players must be at least 18 years of age.
Traditional Lottery Games
The Lottery’s portfolio of traditional games is comprised of two basic types: instant scratch-off and draw-based games. Tickets for traditional lottery games are sold through a statewide network of more than 9,600 licensed retailers.
Instant scratch-off games consist of pre-printed paper tickets. These games have a wide variety of themes and ticket prices. The PA Lottery currently offers more than 40 scratch-off games, with prices ranging from $1 to $30 per ticket.
In February 2017, the PA Lottery added a new category of instant win games called Fast Play. Tickets print from a lottery terminal at the time of purchase and immediately determine if the ticket is a winner. More than two dozen Fast Play games are currently available and range in price between $1 and $30 per ticket.
PA Lottery currently operates eight draw games, including Cash 5, Match 6, Treasure Hunt, Millionaire Raffle, and the PICK family of games. Game tickets are printed at lottery terminals and drawings are conducted to select the winning numbers. The frequency of drawings varies by game.
Pennsylvania participates with several other states in three multi-state games, including the two large jackpot games Powerball and Mega Millions. The Lottery began selling tickets for Powerball in June 2002 and Mega Millions in January 2010. It joined Cash4Life, an annuity game played in ten states, in April 2015. As of August 23, 2021, Powerball drawings will now be drawn three days a week (Monday, Wednesday, and Saturday). Drawings for Mega Millions are held twice a week and Cash4Life is drawn nightly.
In 2018, the Lottery added monitor games to its product portfolio: Keno and Xpress Sports. Both are high-frequency draw games giving players the opportunity to win every four minutes. Players watch the results on large wall-mounted monitors at participating Lottery retailers, including bars and taverns.
The chart that follows shows Lottery sales from traditional games for the last ten years. From 2011/12 through 2020/21, traditional sales increased by $1.84 billion, or 52.9 percent. (A detailed itemization of annual lottery sales, by game, can be found in Appendix A.)
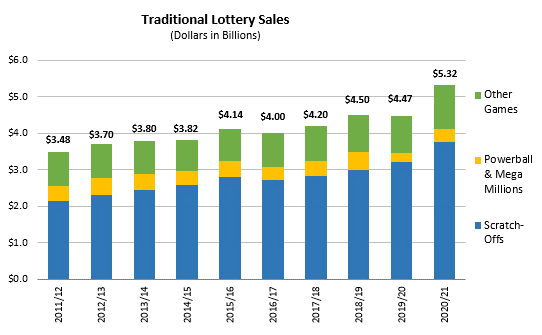
SOURCE: Pennsylvania Lottery, "Comparative Statement of Income and Expenditures" as of June 30 for each year
Scratch-off tickets make up the majority of traditional sales. These games accounted for $3.76 billion or about 71 percent of sales in 2020/21. Scratch-off sales have been shifting toward the games with higher price points and prize payouts. Powerball and Mega Millions are also key revenue generators. Annual sales of these games depend on the size and number of large jackpots during the year. These games accounted for $374 million or about 7 percent of sales for 2020/21.
iLottery
The Pennsylvania Lottery launched its iLottery platform in May 2018, allowing players to purchase internet games through their computers, tablets, and mobile devices.
By law, players must be at least 18 years of age and physically located in Pennsylvania to play iLottery games. To participate, players register for iLottery and create an online account. New account holders must submit proof of identity and age. The PA Lottery uses geolocation technology to detect players’ locations and ensure no iLottery play takes place out-of-state.
At first, iLottery offered a limited selection of eleven internet instant games. iLottery currently offers more than 90 instant games and two Keno-style games. Play costs start as low as ten cents.
Players are now able to purchase several traditional lottery games through the iLottery platform. Powerball and Mega Millions became available beginning in January of 2020 along with Treasure Hunt and Cash4Life, which became available beginning in August of 2020.
iLottery generated $887 million in gross sales in 2020/21. Historical sales are included in Appendix A. Gross sales do not include sales for the traditional games that are now available for purchase through the iLottery platform.
LOTTERY EXPENSES
The PA Lottery operates as a bureau within the Department of Revenue. In addition to its headquarters in Middletown, the PA Lottery has seven regional offices located in Philadelphia, Pittsburgh, Wilkes-Barre, Clearfield, Erie, Lehigh Valley, and Harrisburg.
Traditional Lottery Expenses
The following chart shows the ten-year history of expenses associated with operating traditional Lottery games. Expenses fall into four general categories: prizes, retailer commissions, vendor commissions, and administrative costs. (See Appendix B for breakdown of traditional lottery expenses for 2011/12 through 2020/21.)
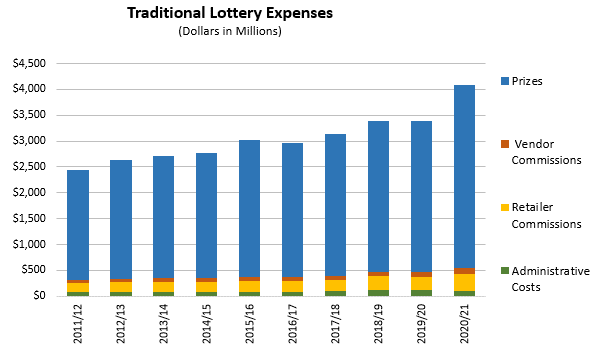
SOURCE: Pennsylvania Lottery, "Comparative Statement of Income and Expenditures" as of June 30 for each year
Prizes make up most of PA Lottery expenses. As shown in the table that follows, prizes as a percent of sales increased from 60.92 percent in 2011/12 to 66.60 percent in 2020/21. This increase reflects the shifting of PA Lottery’s sales mix to games with higher prize payout percentages.
| Traditional Lottery Expenses as Percent of Sales |
| |
|
Retailer |
|
|
| Fiscal |
Prize |
Commissions |
Vendor |
Administrative |
| Year |
Liability |
and Incentives |
Commissions |
Costs |
| 2011/12 |
60.92% |
5.28% |
1.62% |
2.10% |
| 2012/13 |
62.14% |
5.30% |
1.68% |
2.07% |
| 2013/14 |
62.55% |
5.33% |
1.67% |
2.04% |
| 2014/15 |
63.14% |
5.32% |
1.83% |
1.98% |
| 2015/16 |
63.84% |
5.28% |
1.89% |
1.89% |
| 2016/17 |
64.69% |
5.28% |
1.70% |
2.22% |
| 2017/18 |
64.76% |
5.31% |
1.84% |
2.23% |
| 2018/19 |
65.00% |
5.91% |
1.93% |
2.55% |
| 2019/20 |
65.47% |
5.75% |
2.12% |
2.55% |
| 2020/21 |
66.60% |
6.18% |
2.22% |
1.83% |
SOURCE: Pennsylvania Lottery, "Comparative Statement of Income and Expenditures" as of June 30 for each year
iLottery Expenses
The following table shows iLottery expenses for 2018/19 through 2020/21.
- iLottery paid out 87.7 percent of sales revenue as prizes, for a total of $777.5 million in 2020/21. Promotions, bonuses, and special offers to players totaled another $13.1 million, or 1.5 percent of sales.
- Vendor costs and commissions totaled $18 million, representing 2 percent of sales in 2020/21.
- Administrative expenses – advertising, personnel, and other operating costs – totaled $9.5 million, or 1.1 percent of sales in 2020/21.
| iLottery Expenses as Percent of Sales |
| Fiscal |
Prize |
Promotion & |
Vendor Costs & |
|
|
| Year |
Liability |
Bonuses |
Commissions |
Advertising |
Operations |
| 2018/19 |
87.0% |
1.0% |
1.3% |
2.0% |
0.4% |
| 2019/20 |
87.2% |
1.5% |
1.7% |
1.0% |
0.3% |
| 2020/21 |
87.7% |
1.5% |
2.0% |
0.8% |
0.3% |
SOURCE: Pennsylvania Lottery, "Comparative Statement of Income and Expenditures" as of June 30, 2019
LOTTERY PROFITS
The following chart shows PA Lottery profits, excluding the Retail Incentive Program, since 2011/12. The PA Lottery has contributed more than $1 billion to senior programs for ten consecutive years.
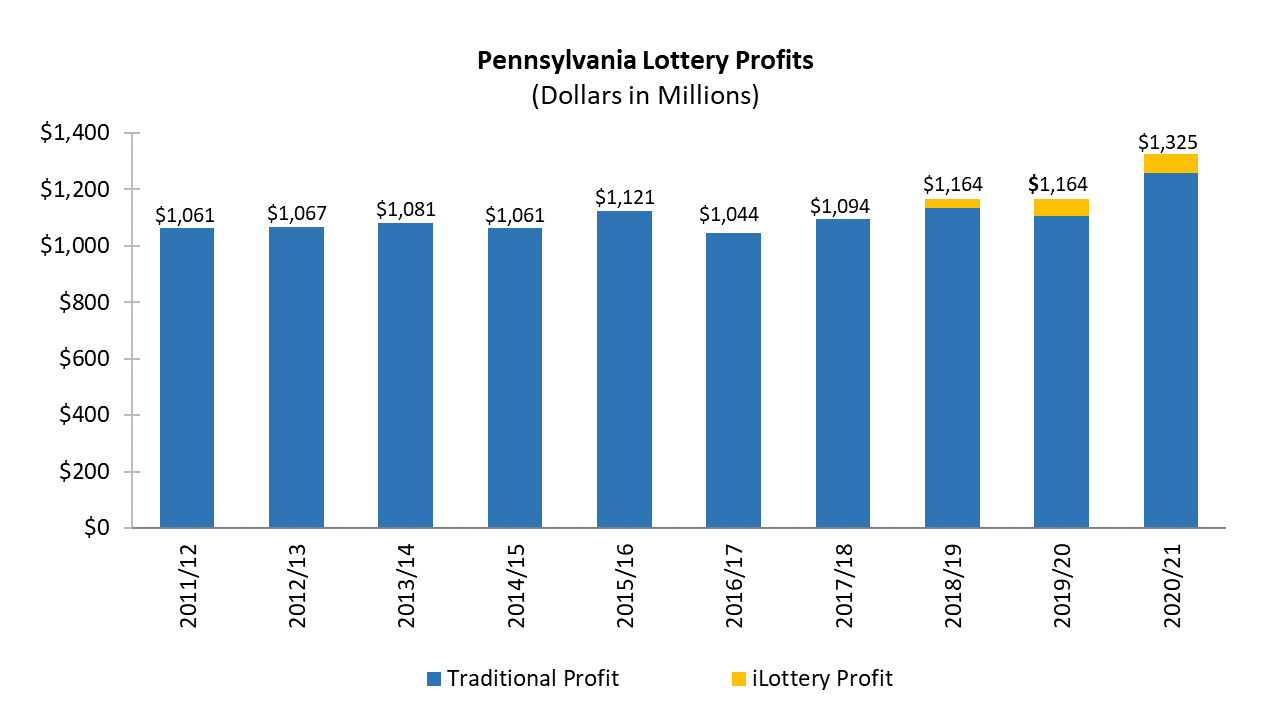
SOURCE: Pennsylvania Lottery, "Comparative Statement of Income and Expenditures" as of June 30 for each year
Current law (Act 97 of 2019) requires the Pennsylvania Lottery to dedicate at least 20 percent of each dollar earned from traditional games to programs benefitting seniors. This mandated profit rate applies to fiscal years 2019/20 through 2023/24. The rate will return to 25 percent on July 1, 2024, unless extended by the General Assembly.
The Department of Revenue has been advocating for lowering or eliminating the profit margin requirement as they have seen increased demand for higher payout games which often come with lower profit guarantees. Pennsylvania is one of only seven state lotteries with a profit percentage requirement. Nationwide, Pennsylvania ranks 6th in lottery net proceeds. None of the five highest grossing state lottery programs have a profit mandate.
Act 42 of 2017 (which authorized iLottery and established the Retail Incentive Program) excludes iLottery revenues and retailer incentive program payments from the profit mandate in the State Lottery Law.
LOTTERY FUND AND SENIOR PROGRAMS
Profits, after paying prizes and expenses, go toward programs benefitting seniors. The 1971 statute targeted PALottery proceeds at providing property tax relief for seniors in the form of rebates. Since then, lottery-supported programs have expanded to include rent rebates, transportation services, pharmaceutical assistance, home and community-based services, and Medicaid long-term care programs.
Four state agencies – Aging, Revenue, Transportation and Human Services – administer programs funded with PALottery revenue. Lottery-supported programs in the departments of Aging and Human Services receive annual appropriations from the Lottery Fund as part of the annual state budget. Lottery-supported programs in the departments of Revenue and Transportation receive funding under executive authorizations which do not require approval by the General Assembly. (See Appendix C for a breakdown of annual Lottery Fund spending by agency and program for the most recent available ten fiscal years.)
Aging. The Department of Aging administers and oversees a broad array of programs that serve older Pennsylvanians. The department’s budget is funded primarily with Lottery Fund revenue and federal funding received under the Older Americans Act – it receives no General Fund revenue.
Two programs consume most of the Lottery revenue appropriated to the agency: pharmaceutical assistance (PACE) and PENNCARE. The department provides low-cost prescription drug coverage to qualifying seniors through three programs: PACE, PACENET and PACE Plus Medicare. PENNCARE provides grants to the local Area Agencies on Aging for services such as home-delivered meals, protective services, and in-home care.
Revenue. The Department of Revenue administers the Property Tax and Rent Rebate Program (PTRR), which benefits seniors age 65 and over, widows and widowers age 50 and over, and people with disabilities age 18 and older. The maximum standard rebate is $650, but supplemental rebates for qualifying homeowners can boost rebates to $975. Income eligibility for PTRR is established by law and does not include an automatic inflator or cost of living adjustment. Because there is no automatic inflator or recognition of cost of living adjustments in some fixed income streams received by seniors, such as Social Security Income, fewer and fewer Pennsylvanians qualify each year.
In accordance with Special Session Act 1 of 2006, slots revenue from the State Gaming Fund is annually transferred to the Lottery Fund for property tax rebates. This transfer represents more than half of annual Lottery Fund spending on the PTRR program. In 2018/19, the Lottery Fund received a $141.7 million transfer from the State Gaming Fund and paid property tax and rent rebates totaling $251.2 million. In 2019/20, the Lottery Fund received a $265.0 million transfer from the State Gaming Fund and paid property tax and rent rebates totaling $482.4 million. This increase was due to Act 20 of 2020 which allowed early disbursement of 2020/21 property tax and rent rebates in 2019/20 due to the COVID-19 pandemic.
Transportation. The Department of Transportation administers two transit programs for Pennsylvanians age 65 and over. The Free Transit program offers free rides on local bus routes and rapid-transit lines during all operating times on weekdays, weekends, and holidays. The Shared Ride program offers curb-to-curb transportation services at a discounted rate equal to 15 percent of the fare; the Lottery Fund pays the remaining 85 percent of the fare.
Human Services. The vast majority of Lottery Funds appropriated to the Department of Human Services are used for Medicaid long-term services and supports provided to eligible seniors. Programs include nursing facility care and home and community-based waiver services provided for by the Community HealthChoices program. To a much smaller extent, the Lottery Fund is used for the Medical Assistance Transportation Program.
Appendix A. Pennsylvania Lottery Sales by Game - Ten Year History
| (Dollars in Millions) |
|
|
|
|
|
|
|
|
|
|
| |
2011/12 |
2012/13 |
2013/14 |
2014/15 |
2015/16 |
2016/17 |
2017/18 |
2018/19 |
2019/20 |
2020/21 |
| Traditional Lottery Sales |
$3,480.9 |
$3,699.7 |
$3,799.6 |
$3,819.6 |
$4,135.2 |
$4,001.0 |
$4,200.6 |
$4,503.3 |
$4,473.7 |
$5,323.9 |
| Instant "Scratch-Off" Games |
2,134.6 |
2,305.1 |
2,444.9 |
2,591.6 |
2,792.7 |
2,726.6 |
2,824.2 |
2,989.7 |
3,203.2 |
3,757.9 |
| Fast Play |
- |
- |
- |
- |
- |
55.0 |
114.4 |
103.3 |
102.7 |
143.9 |
| Draw Games: |
|
|
|
|
|
|
|
|
|
|
| Pick 2 |
- |
- |
- |
7.0 |
8.6 |
7.0 |
6.0 |
5.7 |
5.6 |
6.4 |
| Pick 3 |
- |
- |
- |
310.9 |
294.0 |
283.8 |
270.4 |
269.2 |
266.2 |
305.8 |
| Pick 4 |
- |
- |
- |
234.8 |
232.7 |
229.6 |
220.7 |
225.3 |
224.9 |
260.9 |
| Pick 5 |
- |
- |
- |
43.8 |
45.8 |
45.9 |
44.8 |
46.5 |
48.3 |
60.8 |
| Wild Ball |
- |
- |
- |
- |
- |
23.4 |
25.8 |
28.4 |
31.3 |
47.5 |
| Cash 5 |
159.9 |
167.5 |
151.5 |
136.2 |
137.1 |
129.9 |
109.6 |
115.0 |
93.6 |
93.6 |
| Match 6 |
66.0 |
65.1 |
95.9 |
68.0 |
67.2 |
79.6 |
113.4 |
130.5 |
131.6 |
146.2 |
| Treasure Hunt |
24.3 |
25.7 |
28.6 |
28.6 |
29.1 |
31.8 |
27.4 |
26.4 |
28.6 |
32.6 |
| Millionaire Raffle |
20.9 |
20.4 |
19.9 |
17.6 |
31.6 |
18.8 |
11.7 |
10.0 |
10.0 |
10.0 |
| Daily Number |
359.9 |
345.1 |
329.7 |
- |
- |
- |
- |
- |
- |
- |
| Big 4 |
245.6 |
242.9 |
238.6 |
- |
- |
- |
- |
- |
- |
- |
| Quinto |
40.7 |
43.2 |
43.2 |
- |
- |
- |
- |
- |
- |
- |
| Monopoly Millionaires Club |
- |
- |
- |
5.0 |
- |
- |
- |
- |
- |
- |
| Multi-State Games |
|
|
|
|
|
|
|
|
|
|
| Powerball |
277.7 |
400.9 |
301.4 |
239.8 |
358.0 |
252.6 |
272.7 |
260.5 |
139.8 |
195.5 |
| Mega Millions |
151.2 |
83.8 |
145.9 |
124.9 |
106.4 |
94.4 |
133.9 |
229.5 |
108.4 |
178.5 |
| Cash4Life |
- |
- |
- |
11.3 |
32.1 |
22.5 |
17.8 |
16.7 |
25.6 |
29.4 |
| Monitor Games: |
|
|
|
|
|
|
|
|
|
|
| Keno |
- |
- |
- |
- |
- |
- |
7.6 |
44.5 |
47.2 |
41.6 |
| Xpress Sports |
- |
- |
- |
- |
- |
- |
- |
2.2 |
6.5 |
13.3 |
| iLottery Play |
- |
- |
- |
- |
- |
- |
$20.8 |
$381.5 |
$731.3 |
$887.0 |
| TOTAL SALES |
$3,480.9 |
$3,699.7 |
$3,799.6 |
$3,819.6 |
$4,135.2 |
$4,001.0 |
$4,221.4 |
$4,884.8 |
$5,205.0 |
$6,210.9 |
| SOURCE: Pennsylvania Lottery Bureau, "Comparative Statement of Income and Expenditures" as of June 30 for each year. |
|
|
|
|
|
Appendix B. Traditional Lottery Expenses - Ten Year History
|
(Dollars in Millions)
|
|
|
|
2011/12
|
2012/13
|
2013/14
|
2014/15
|
2015/16
|
2016/17
|
2017/18
|
2018/19
|
2019/20
|
2020/21
|
|
|
Prize Liability
|
$2,120.5
|
$2,299.0
|
$2,376.7
|
$2,411.7
|
$2,639.8
|
$2,588.3
|
$2,733.8
|
$2,927.1
|
$2,929.1
|
$3,545.5
|
|
|
Commissions and Incentives:
|
|
|
|
|
|
|
|
|
|
|
|
|
Retailer Commissions
|
183.9
|
196.1
|
202.4
|
203.2
|
218.3
|
211.4
|
224.2
|
245.0
|
234.9
|
306.7
|
|
|
Instant Vendor Commissions
|
22.1
|
24.4
|
24.8
|
31.2
|
37.0
|
26.4
|
33.3
|
32.6
|
39.3
|
50.1
|
|
|
Online Vendor Commissions
|
34.2
|
37.9
|
38.7
|
38.5
|
41.3
|
41.7
|
44.5
|
54.1
|
55.3
|
68.3
|
|
|
Retailer Incentive Program
|
-
|
-
|
-
|
-
|
-
|
-
|
-
|
21.0
|
22.5
|
22.3
|
|
|
Administrative Costs:
|
|
|
|
|
|
|
|
|
|
|
|
|
Advertising
|
37.0
|
36.8
|
34.3
|
40.0
|
44.0
|
44.0
|
48.2
|
43.2
|
43.7
|
43.8
|
|
|
Lottery Bureau Operations*
|
36.1
|
39.7
|
43.1
|
35.8
|
34.2
|
44.7
|
45.8
|
71.9
|
70.5
|
53.6
|
|
|
TOTAL EXPENSES
|
$2,433.8
|
$2,633.9
|
$2,719.9
|
$2,760.4
|
$3,014.7
|
$2,956.5
|
$3,129.8
|
$3,394.9
|
$3,395.4
|
$4,090.3
|
|
|
SOURCE: Pennsylvania Lottery Bureau, "Comparative Statement of Income and Expenditures" as of June 30 for each year
|
|
|
|
|
* Expenses include personnel and other operating costs
|
Appendix C. Lottery Fund Expenditures for Senior Programs - Ten Year History
| (Dollars in Thousands) |
|
|
|
|
|
|
|
|
|
|
| Department / Appropriation |
2010/11 |
2011/12 |
2012/13 |
2013/14 |
2014/15 |
2015/16 |
2016/17 |
2017/18 |
2018/19 |
2019/20 |
| SENIOR PROGRAMS - TOTAL FUNDING |
$1,089,522 |
$1,103,770 |
$1,228,676 |
$1,214,514 |
$1,411,620 |
$1,284,366 |
$1,303,346 |
$1,220,362 |
$1,300,334 |
$1,446,780 |
| Department of Aging: |
|
|
|
|
|
|
|
|
|
|
| PennCARE |
243,283 |
248,764 |
248,164 |
275,164 |
299,306 |
314,282 |
331,246 |
336,062 |
333,778 |
292,857 |
| Pharmaceutical Assistance Fund Transfer |
200,000 |
200,000 |
190,000 |
130,000 |
155,000 |
175,000 |
169,000 |
155,000 |
155,000 |
140,000 |
| Pre-Admission Assessment |
10,735 |
10,735 |
10,735 |
10,735 |
10,735 |
18,000 |
19,916 |
19,916 |
8,749 |
8,750 |
| Caregiver Support |
12,103 |
12,103 |
12,103 |
12,103 |
12,103 |
12,103 |
12,103 |
12,103 |
11,573 |
12,103 |
| Grants to Senior Centers |
- |
- |
- |
2,150 |
2,000 |
2,000 |
2,000 |
2,000 |
2,000 |
2,000 |
| Alzheimer's Outreach |
250 |
250 |
250 |
250 |
250 |
250 |
250 |
250 |
250 |
250 |
| Department of Human Services: |
|
|
|
|
|
|
|
|
|
|
| Medical Assistance Long-Term Care |
178,438 |
178,438 |
309,081 |
309,081 |
309,081 |
184,081 |
184,081 |
129,281 |
81,381 |
- |
| Home and Community Based Services |
- |
- |
- |
21,000 |
162,577 |
120,668 |
120,668 |
120,668 |
120,668 |
- |
| Medical Assistance Transportation |
- |
- |
- |
- |
4,900 |
4,900 |
3,300 |
3,500 |
3,500 |
3,500 |
| Community Health Choices |
- |
- |
- |
- |
- |
- |
- |
- |
166,806 |
334,013 |
| Department of Revenue: |
|
|
|
|
|
|
|
|
|
|
| Property Tax/Rent Rebates * |
283,395 |
284,870 |
286,100 |
280,100 |
278,250 |
271,200 |
281,900 |
262,700 |
251,200 |
482,400 |
| Department of Transportation: |
|
|
|
|
|
|
|
|
|
|
| Free Rides (Transfer to Public Transportation Trust Fund) |
88,199 |
89,610 |
91,268 |
92,956 |
94,443 |
95,907 |
95,907 |
95,907 |
95,907 |
95,907 |
| Older PA Shared Rides |
73,119 |
79,000 |
80,975 |
80,975 |
82,975 |
85,975 |
82,975 |
82,975 |
69,522 |
75,000 |
| PROGRAM ADMINISTRATION - TOTAL FUNDING |
$20,141 |
$19,977 |
$20,552 |
$21,594 |
$21,485 |
$23,967 |
$24,496 |
$23,194 |
$23,613 |
$24,394 |
| Department of Aging: |
|
|
|
|
|
|
|
|
|
|
| General Government Operations |
7,100 |
6,705 |
6,705 |
7,861 |
7,927 |
9,058 |
9,272 |
8,331 |
8,315 |
8,743 |
| Department of Revenue: |
|
|
|
|
|
|
|
|
|
|
| Property Tax/Rent Rebates General Operations |
13,041 |
13,272 |
13,847 |
13,733 |
13,558 |
14,909 |
15,224 |
14,863 |
15,298 |
15,651 |
| SOURCE: Governor’s Executive Budgets for fiscal years 2010/11 through 2019/20, Section C-3, “Lottery Fund Summary by Department” (actual year expenditures) |
|
| * Property Tax/Rent Rebate program is funded with lottery proceeds and the following transfers from the State Gaming Fund (dollars in thousands): |
|
|
|
|
|
|
2010/11 |
2011/12 |
2012/13 |
2013/14 |
2014/15 |
2015/16 |
2016/17 |
2017/18 |
2018/19 |
2019/20 |
| State Gaming Fund transfers to Lottery Fund |
$165,900 |
$164,100 |
$166,800 |
$166,500 |
$162,800 |
$166,800 |
$148,000 |
$145,700 |
$141,700 |
$265,000 |
| Percent of property tax and rent rebates |
58.5% |
57.6% |
58.3% |
59.4% |
58.5% |
61.5% |
52.5% |
55.5% |
56.4% |
54.9% |
| SOURCE: Governor’s Executive Budgets for fiscal years 2010/11 through 2019/20, Section C-3, “Revenue Summary: Five Year Revenue Projections” (actual year revenue) |
|