General Fund Revenue Report - November 2023
By Brittany Van Strien , Budget Analyst | one year ago
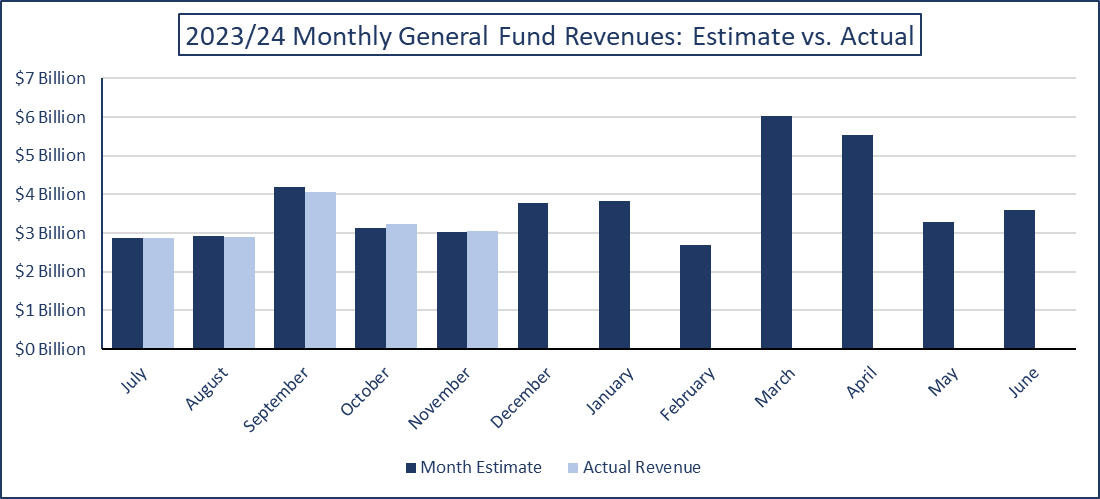
General Fund revenues in November were $46.4 million or 1.5% more than expected.
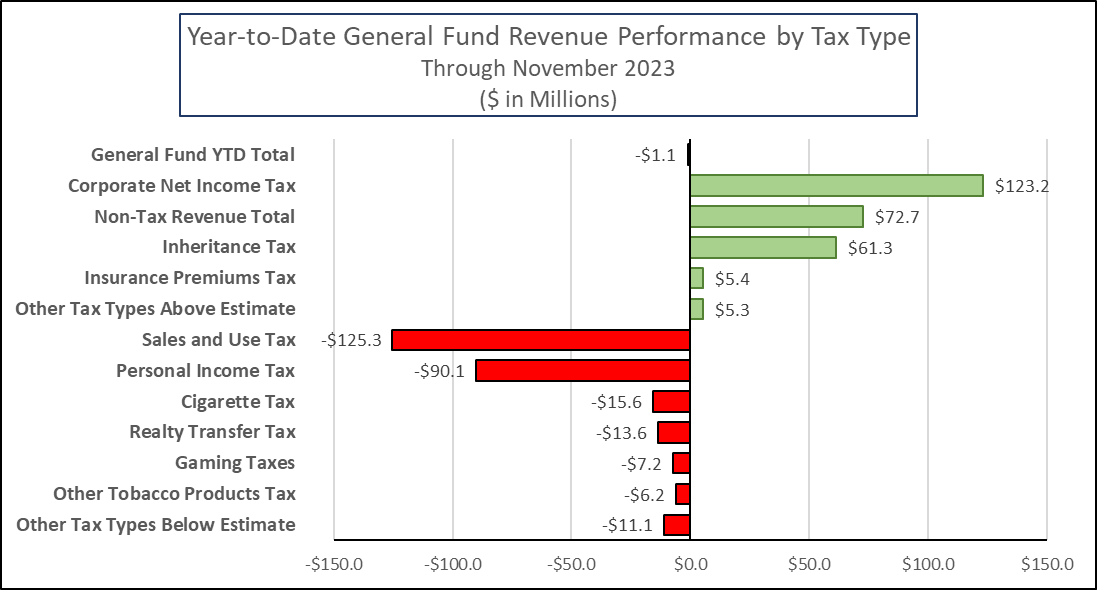
For the year-to-date, General Fund revenues are $1.1 million or 0.01% below estimate.
Corporate net income tax (CNIT) collections were $66.4 million or 35.2% higher than expected in November. For the fiscal year-to-date, CNIT is outperforming estimates by $123.2 million or 7.5%.
Non-tax revenue also finished the month higher than expected by $24.8 million or 16.8%. It should be noted that non-tax revenue collections this month were impacted by the first installment of the liquor store profit transfer being made by the Pennsylvania Liquor Control Board, totaling $100 million. This transfer was anticipated and therefore built into the November projections for non-tax revenue. The remainder of the profit transfer, expected to be $85.1 million, will be transferred to the General Fund later in the fiscal year.
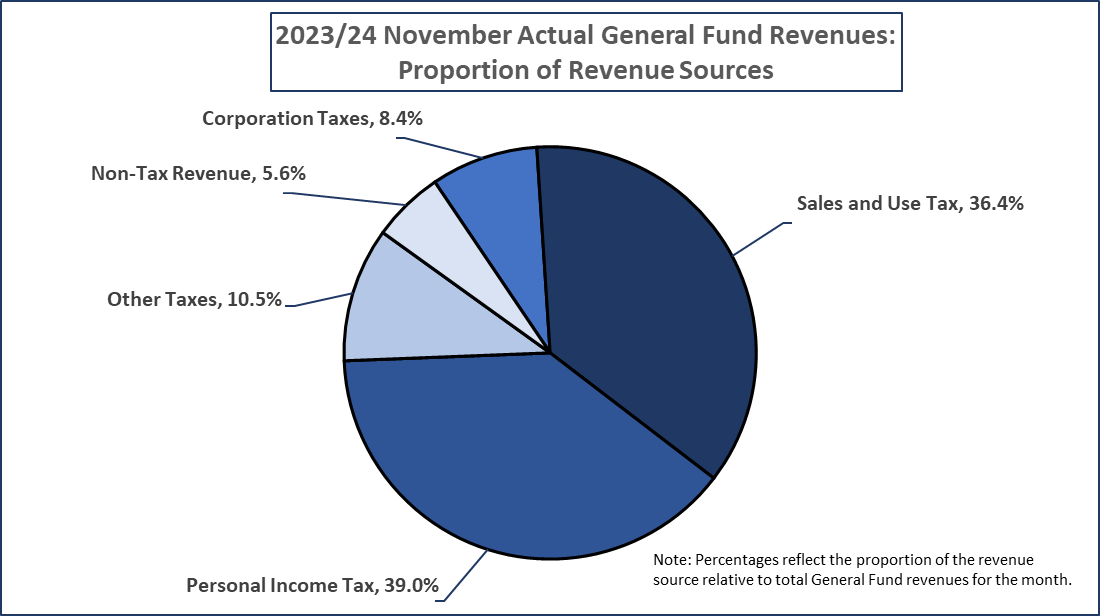
Sales and use tax (SUT) revenue was $19.6 million or 1.7% lower than expected for the month. Collections from motor vehicle sales were $0.7 million or 0.7% higher than estimated, but collections from nonmotor vehicle sales were $20.3 million or 2.0% below estimate. For the year-to-date, SUT is $125.3 million or 2.0% under projections.
Similarly, personal income tax (PIT) revenue underperformed in November by $13.0 million or 1.1%. Although non-withholding payments were $8.7 million or 15.4% above estimate, withholding payments were $21.7 million or 1.9% less than projected. For the year-to-date, PIT is $90.1 million or 1.4% below estimate.
|
2023/24 General Fund Revenues ($ in Millions)
|
|
|
November 2023 Revenues
|
Year-to-Date Revenues
|
|
|
Month Estimate
|
Month Revenues
|
$ Difference
|
% Difference
|
YTD Estimate
|
YTD Revenues
|
$ Difference
|
% Difference
|
|
General Fund Total
|
$3,015.0
|
$3,061.4
|
$46.4
|
1.5%
|
$16,146.4
|
$16,145.3
|
($1.1)
|
-0.0%
|
|
Tax Revenue
|
$2,867.5
|
$2,889.1
|
$21.6
|
0.8%
|
$15,720.9
|
$15,647.1
|
($73.8)
|
-0.5%
|
|
Corporation Taxes:
|
|
Corporate Net Income Tax
|
$188.8
|
$255.2
|
$66.4
|
35.2%
|
$1,641.1
|
$1,764.3
|
$123.2
|
7.5%
|
|
Gross Receipts Tax
|
$2.9
|
$1.6
|
($1.3)
|
-44.9%
|
$16.2
|
$19.5
|
$3.3
|
20.6%
|
|
Public Utility Realty Tax
|
$0.0
|
$0.1
|
$0.1
|
0.0%
|
$1.2
|
$2.3
|
$1.1
|
92.2%
|
|
Insurance Premiums Taxes
|
$0.1
|
$0.6
|
$0.5
|
521.1%
|
$1.5
|
$6.9
|
$5.4
|
357.6%
|
|
Financial Institution Taxes
|
$1.4
|
($0.1)
|
($1.5)
|
-106.0%
|
$18.7
|
$19.5
|
$0.8
|
4.3%
|
|
Consumption Taxes:
|
|
Sales and Use Tax
|
$1,134.9
|
$1,115.3
|
($19.6)
|
-1.7%
|
$6,127.1
|
$6,001.8
|
($125.3)
|
-2.0%
|
|
Cigarette Tax
|
$78.4
|
$71.0
|
($7.4)
|
-9.4%
|
$339.8
|
$324.2
|
($15.6)
|
-4.6%
|
|
Other Tobacco Products Tax
|
$13.7
|
$12.4
|
($1.3)
|
-9.2%
|
$67.9
|
$61.7
|
($6.2)
|
-9.1%
|
|
Malt Beverage Tax
|
$1.8
|
$1.9
|
$0.1
|
5.1%
|
$10.0
|
$9.2
|
($0.8)
|
-8.2%
|
|
Liquor Tax
|
$40.9
|
$41.2
|
$0.3
|
0.7%
|
$188.4
|
$183.4
|
($5.0)
|
-2.7%
|
|
Other Taxes:
|
|
Personal Income Tax
|
$1,206.7
|
$1,193.7
|
($13.0)
|
-1.1%
|
$6,359.4
|
$6,269.3
|
($90.1)
|
-1.4%
|
|
Realty Transfer Tax
|
$48.0
|
$48.4
|
$0.4
|
0.8%
|
$221.7
|
$208.1
|
($13.6)
|
-6.1%
|
|
Inheritance Tax
|
$114.0
|
$113.9
|
($0.1)
|
-0.1%
|
$590.5
|
$651.8
|
$61.3
|
10.4%
|
|
Gaming Taxes
|
$35.2
|
$33.6
|
($1.6)
|
-4.6%
|
$146.4
|
$139.2
|
($7.2)
|
-4.9%
|
|
Minor and Repealed
|
$0.7
|
$0.2
|
($0.5)
|
-70.7%
|
($9.0)
|
($14.3)
|
($5.3)
|
-58.4%
|
|
Non-Tax Revenue
|
$147.5
|
$172.3
|
$24.8
|
16.8%
|
$425.5
|
$498.2
|
$72.7
|
17.1%
|