PA’s Fair Funding Formula for Basic Education Explained
By Sean Brandon , Assistant Executive Director | 5 years ago
Basic Ed Fair Funding Formula Analysts: Sean Brandon - Assistant Executive Director , Emma Eglinton - Budget Analyst
The 2020/21 budget package put Pennsylvania’s basic education fair funding formula on hold. The move was not represented as a repudiation of the formula, but rather as an attempt to provide stability in uncertain economic times. Nevertheless, the decision establishes a concerning precedent. It also presents an opportunity to explore how the fair funding formula works. This briefing and accompanying spreadsheet explain the mechanics of the fair formula, demonstrate how it works, and outline the surrounding policy issues.
What is Basic Education Funding?
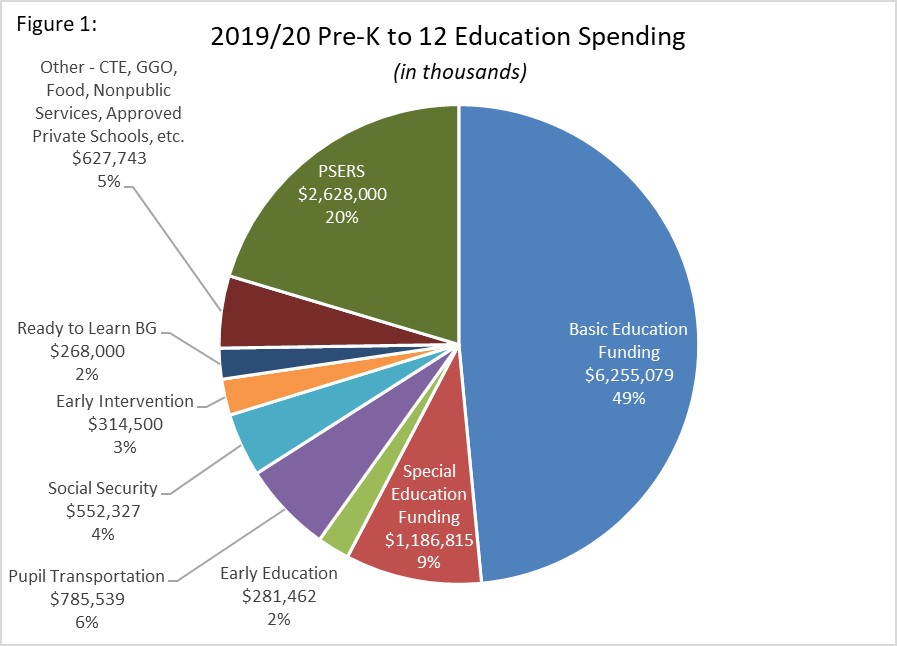
Pennsylvania’s Basic Education Funding (BEF) appropriation provides flexible funding for the commonwealth’s 500 school districts. BEF rightly receives a lot of attention and focus because it is PA’s largest education subsidy, totaling $6.26 billion in 2019/20 (Figure 1). By comparison, the next two largest education subsidies in 2019/20 were the state’s share of the cost of the school employees’ retirement system ($2.6 billion) and special education funding ($1.2 billion).
The Need for a Fair Formula
The total amount appropriated for BEF is only half of the puzzle. The other half is the formula used to divvy up the state BEF among the commonwealth’s 500 school districts. Unfortunately, for many years Pennsylvania’s lack of a consistent and predictable formula made school districts’ jobs of forecasting their budgets very difficult. For example, in the four years between 2011/12 and 2014/15, the state allocated new BEF dollars using four different formulas. Additionally, these makeshift formulas locked-in prior years’ distributions, creating one of the most inequitable education funding systems in the country.1
In 2015, in accordance with Act 51 of 2014, the Basic Education Funding Commission (BEFC), a bipartisan group of members of the General Assembly and administration officials, unanimously recommended a new formula based upon the tenets of accountability, transparency, predictability, and equity. Every five years, the BEFC is statutorily required to “meet and hold public hearings to review the operation of the basic education funding provisions” and issue a new report to the leaders of the General Assembly. The first review by the reconstituted BEFC should have occurred between 2019/20 and 2020/21, but Act 30 of 2020 delayed the first meeting until July 1, 2022 with the report now due by November 30, 2023.
Formula Concept
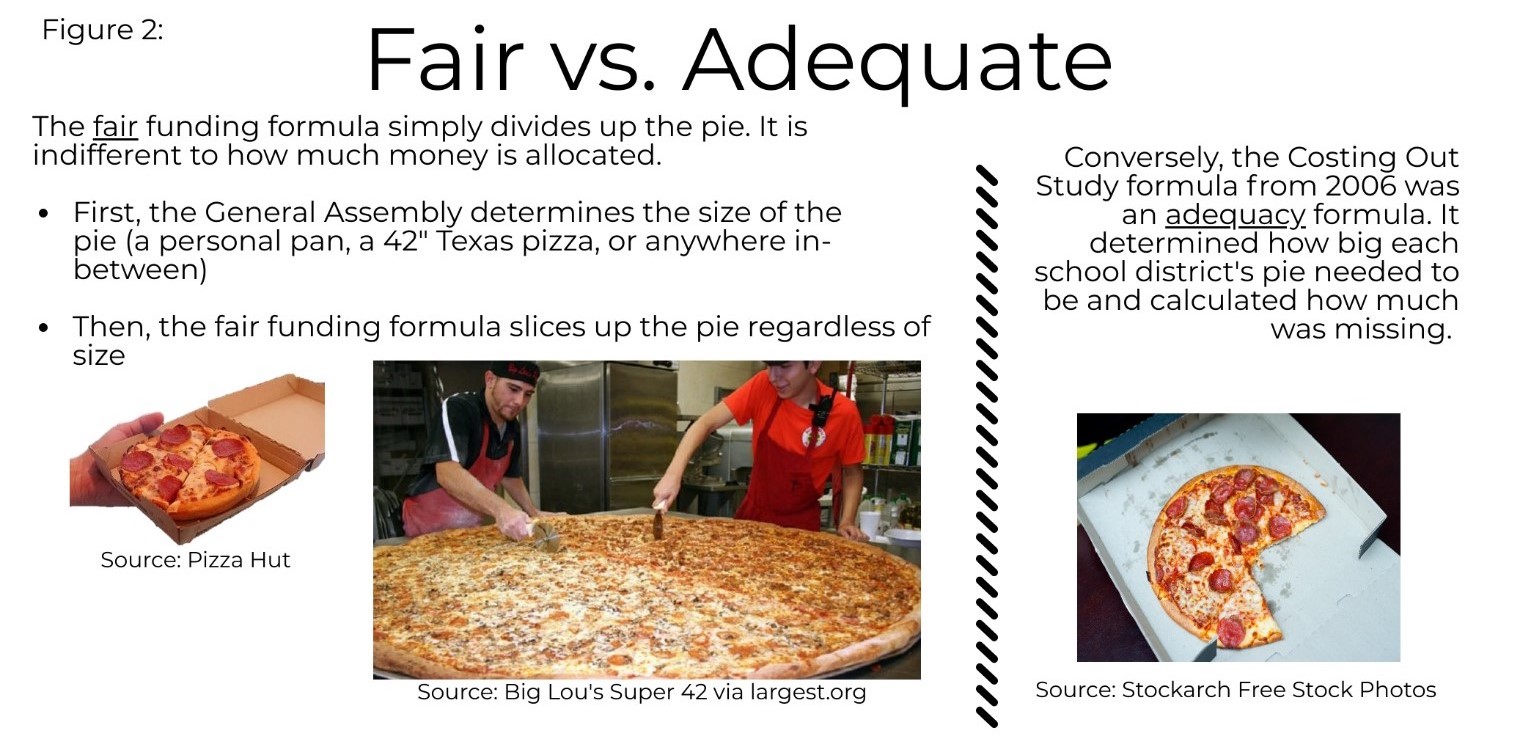
The fair funding formula does not allocate a specific dollar amount to each school district. Instead, it determines each district’s fair share of the amount of funding available to distribute from the state. This is the distinction between deciding what is fair and what is adequate (see Figure 2).
For example, the formula will yield a result saying, out of PA’s 500 school districts, Norristown Area School District should receive 0.47 percent of the funding available. This is different from a result saying Norristown Area School District should receive a $470,000 increase because its costs went up. The fair funding formula determines the appropriate share of funding each school district receives. It does not answer the question: the share of what? This determination is made by the legislature through policymaking and the annual budgeting process.
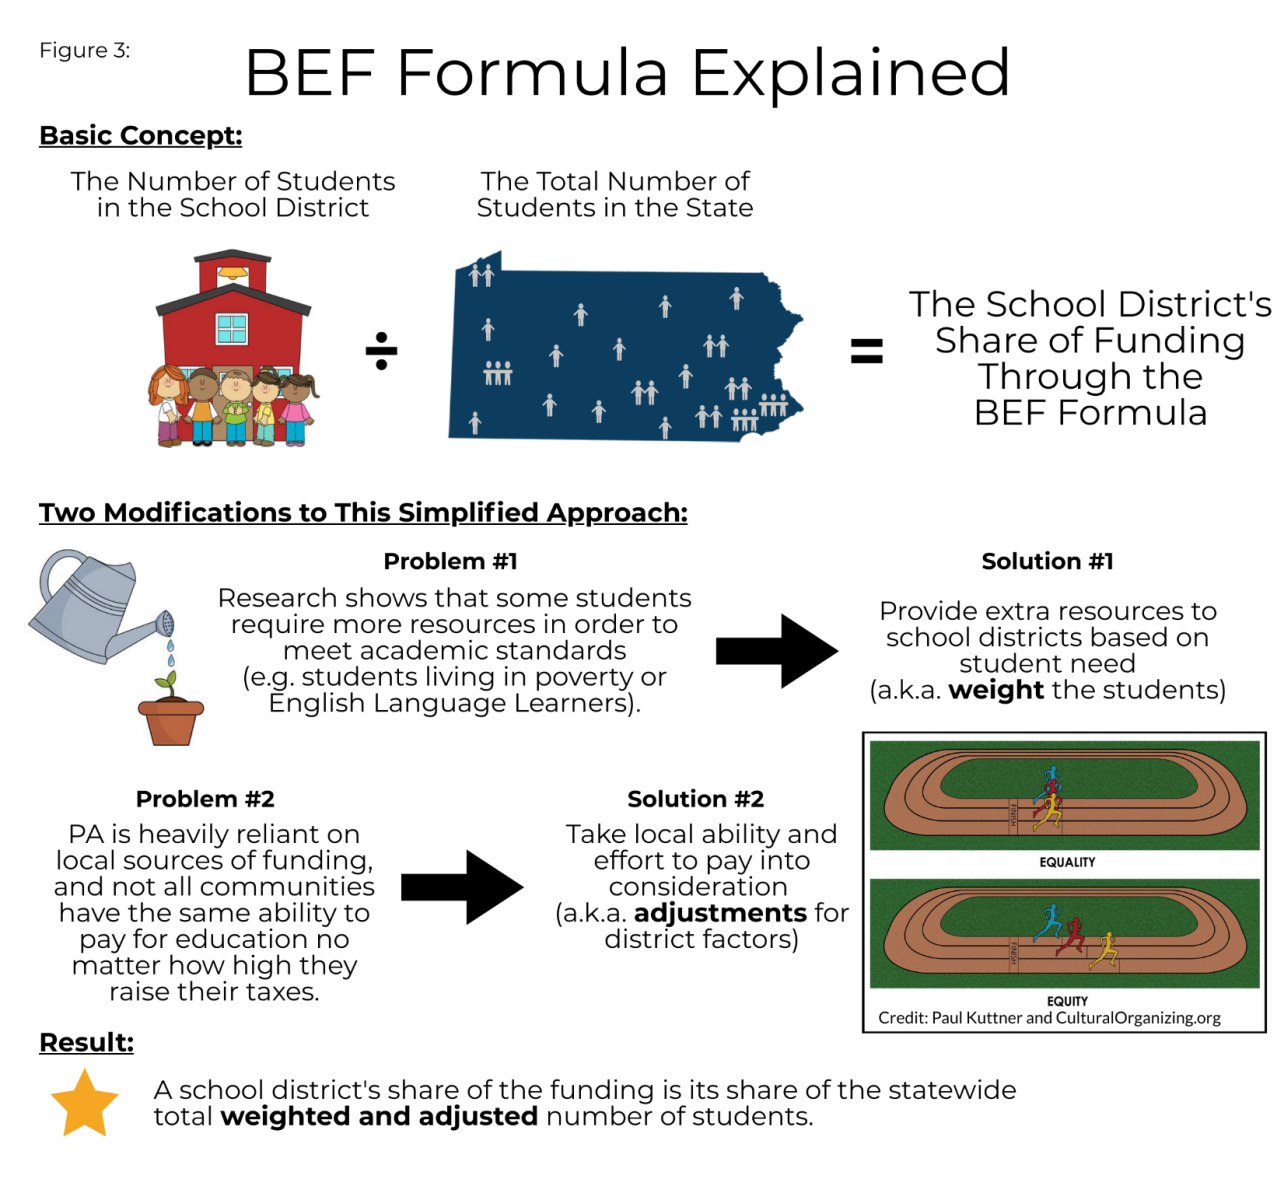
The fair funding formula is student-based, meaning a district’s share of state funding is tied to its share of the student population (measured as average daily membership or ADM). However, each school district is not given the same amount of state funding per student; that would be unfair and would ignore the vast differences in local resources available to districts as well as the research-supported evidence that some students require more resources than others to succeed. Figure 3 provides an overview of the concept of the fair funding formula. The end result is that each school district receives the same amount of formula-driven state funding per weighted and adjusted ADM.
In order to appreciate how the BEFC formula addresses inequities and fairness, one needs to understand what the elements of the formula are and why they were chosen. Tables 5 and 6 at the end of this briefing explore the rationale for the factors and weights/adjustments present in the fair funding formula. There is a dashboard tool available here where you can select a school district to view its formula factors, including how they have changed year-to-year.
“Hold-Harmed”
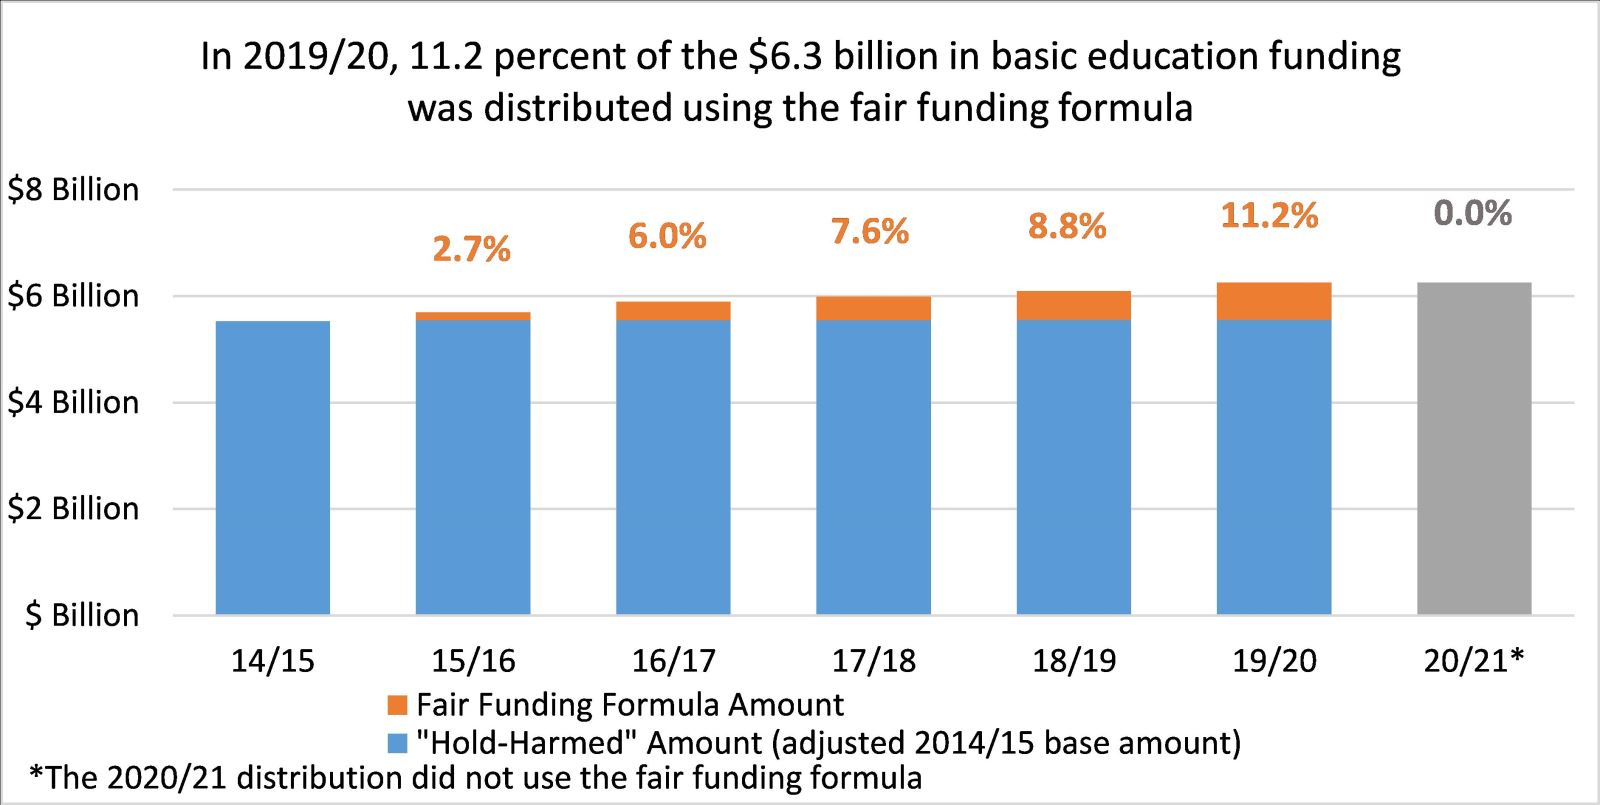
Not all BEF funds are distributed through the fair funding formula. Under Pennsylvania’s current BEF distribution, each school district receives the BEF subsidy amount it received in 2014/15 (with adjustments in a few cases) plus its fair share (determined by the fair funding formula) of new funding added to the BEF total since 2014/15. Therefore, the proportion of basic education funding distributed through the fair funding formula has increased as the appropriation increased (Figure 4). However, many legislators and advocates believe this progress is too slow and are campaigning to make the fair formula apply to a larger portion of the funding more quickly.
Figure 4
The reason the fair formula does not apply to the entire BEF distribution is because of a policy commonly called “hold-harmless.” Despite the innocent connotation, “hold-harmless” translates as “hold-harmed” for the majority of the commonwealth’s students. This is especially true for school districts with students of color making up higher shares of enrollment. To recognize the effect this policy has had on marginalized groups, it will henceforth herein be referred to as “hold-harmed.”
“Hold-harmed” protects a portion of state funding from an updated formula distribution. This practice can be executed in different ways. In Pennsylvania, beginning in 1992/93 and continuing for more than 20 years, “hold-harmed” was applied annually – essentially “you get what you got last year, plus ‘x’ amount of this new money.” With the adoption of the fair funding formula in 2015/16, Pennsylvania moved away from the annual “hold-harmed” policy by freezing the “hold-harmed” guarantee at 2014/15 levels.
“Hold-harmed” created winners and losers in several ways. Generally, growing districts have had to share marginal increases with districts experiencing declining enrollments, creating a gap between the per student levels of state funding. Exacerbating these inequities, many distributions in the ‘80s, ‘90s, and ‘00s required a minimum 1 or 2 percent increase in state funding for each school district. These minimum increases diverted funds from need-based distributions.
Overall, “hold-harmed” ignores up-to-date student counts and socio-economic factors in favor of data from yesteryear. As noted in BEFC’s Final Report, “According to Penn State University Professor William Hartman, 53 percent of the basic education funding subsidy for fiscal year 2013-2014 is based upon data for fiscal year 1990-1991…” (page 21).
Unsurprisingly, the BEF distribution would look very different if the entire appropriation were distributed using the fair funding formula rather than just the 11.2 percent of the total being distributed today. Getting rid of “hold-harmed” altogether would shift $1.2 billion in state funding from the 353 school districts receiving more than their fair share to the 147 school districts (that educate 55 percent of PA’s students) receiving less than their fair share (see Figure 5 and Table 1 below). See linked “20/21 Hold-Harmed” spreadsheet for an individual breakdown for each school district.
Figure 5
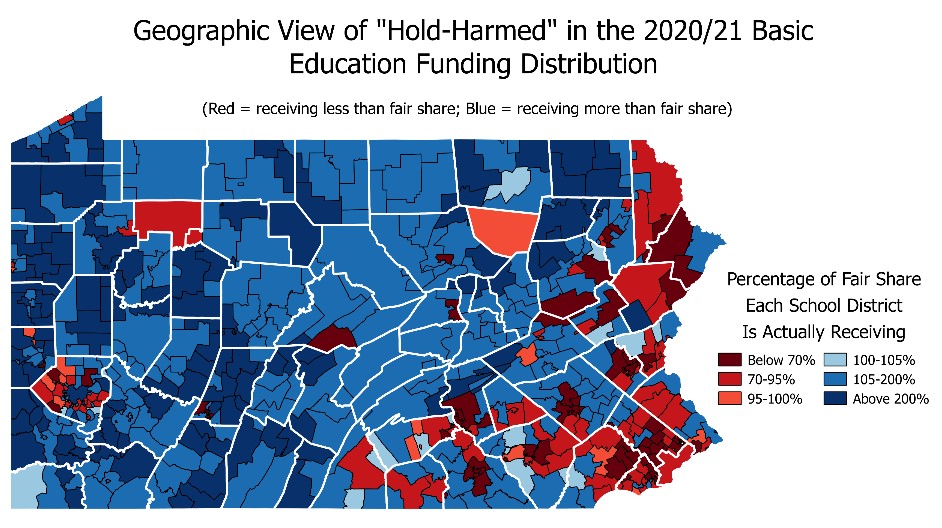
Table 1:
"Hold-Harmed" Analysis in 2020/21 BEF Distribution |
Number of SDs |
Number of Students |
Financial Impact of Completely Eliminating
"Hold-Harmed" |
| More than Fair Share |
353 |
764,531 |
-$1,238,717,564 |
| Less than Fair Share |
147 |
940,111 |
$1,238,717,564 |
| Above 200% |
111 |
179,554 |
-$627,846,535 |
| 105-200% |
226 |
537,265 |
-$607,865,572 |
| 100-105% |
16 |
47,712 |
-$3,005,458 |
| 95-100% |
14 |
60,892 |
$2,807,926 |
| 70-95% |
71 |
518,557 |
$571,417,077 |
| Below 70% |
62 |
360,662 |
$664,492,561 |
Figure 62, below, compares actual per-student BEF funding to what each school district would receive if “hold-harmed” was eliminated. When looking for trends, there are wealthy and poor school districts on both sides of the “hold-harmed” issue (Table 2). One trend is clear, however. Overwhelmingly, it is “hold-harmless” for school districts with predominantly white enrollments and “hold-harmed” for school districts with higher shares of students of color. Nearly 80 percent of Pennsylvania’s students of color are enrolled in a school district that is not receiving its fair share of state funds.
Figure 6
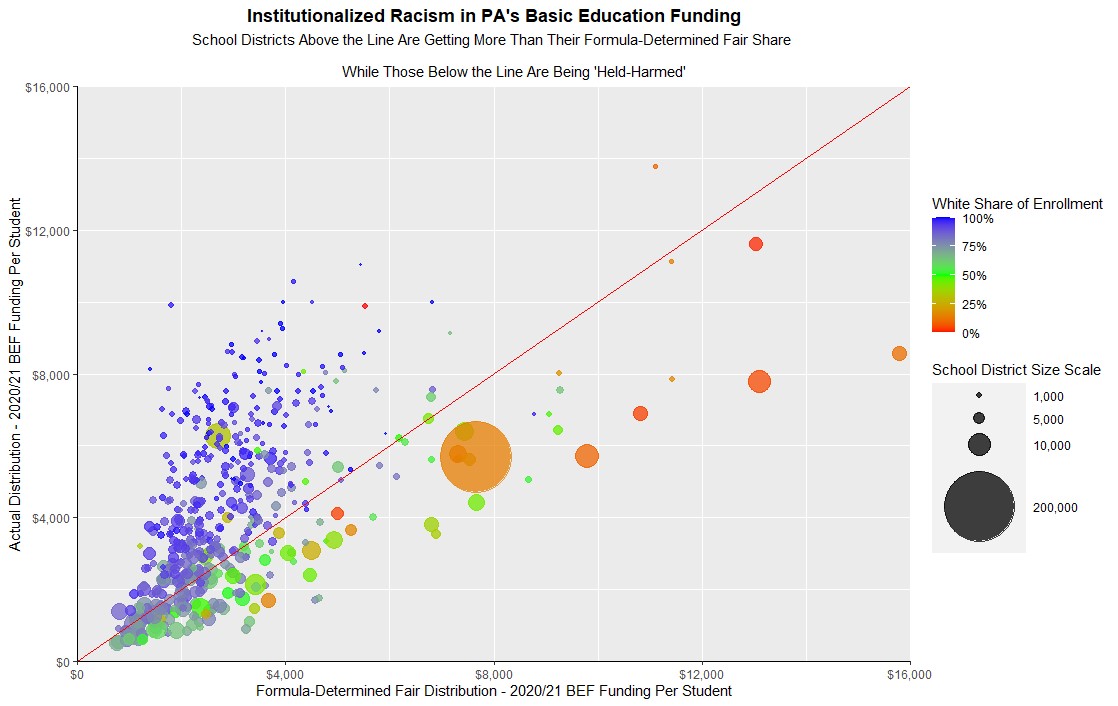
Table 2:
Median Household Income and "Hold-Harmed" |
Number of SDs Receiving: |
| More Than Fair Share |
Less Than Fair Share |
| PA's Poorest 50 Disticts |
16 |
34 |
| Second Decile |
28 |
22 |
| Third Decile |
35 |
15 |
| Fourth Decile |
31 |
19 |
| Fifth Decile |
39 |
11 |
| Sixth Decile |
44 |
6 |
| Seventh Decile |
46 |
4 |
| Eighth Decile |
43 |
7 |
| Ninth Decile |
43 |
7 |
| PA's Wealthiest 50 Districts |
28 |
22 |
How to handle Pennsylvania’s “hold-harmed” legacy was one of the biggest policy decisions confronting BEFC. Ultimately, BEFC agreed to two guiding principles on the issue of “hold-harmed.” First, they recommended that no new money should be subject to a “hold-harmed” provision. This was a huge step for Pennsylvania education funding policy as it went against the past 20 years of practice. Second, BEFC asserted that abruptly eliminating the existing “hold-harmed” practice would have an insurmountable budgetary impact – a median decline of 10.6 percent in total revenue – among the 355 school districts receiving more than their fair share.
Beyond these two recommendations, BEFC did not take a position on how to deal with “hold-harmed,” but they did identify three gradual ways for the General Assembly to address the issue:
- Option 1 (the option implemented by the General Assembly): Select a base year of funding and distribute all funds above that amount through BEFC’s recommended formula. For example, each district’s allocation begins with what it received in 2014/15 and any funding appropriated above that amount is distributed through the fair formula. Under this scenario, a school district is always guaranteed to receive at least the state funding it received in 2014/15.
- Option 2: Starts with Option 1, but then prioritizes new funding for school districts that are receiving less than their fair share.
- For example, the legislature could decide to use a base year of 2014/15 and provide a $100 million basic education funding increase through the formula. Suppose when the entire basic education funding appropriation is distributed through the formula, District A’s allocation is greater than what is prescribed by the formula (receiving more than its fair share) and District B’s allocation is lower (receiving less than its fair share). If District A was due a $100,000 increase from the new money, a certain percentage, maybe 50 percent, would be redistributed to District B and other school districts that are victims of “hold-harmed.”
- Reps. Flynn and Mullins introduced HB1790, which would allocate 75 percent of all new funding to the school districts not receiving their fair share.
- Option 3: Gradually expand the percentage of basic education funding distributed through the fair formula.
- For example, 10 percent of the funds go through the formula in year 1, 20 percent in year 2, and so on until 100 percent is reached in year 10. Dollars not funneled through the formula would be distributed pro rata based on a district’s existing share of basic education funds.
- Rep. Cox authored HB1313, which would reduce the base share by 20 percent each year.
- Rep. Rabb introduced HB961, which would not use the gradual approach but rather allocate 100 percent of the total basic education funds using the fair formula.
Finally, the Ready to Learn Block Grant should be included in the “hold-harmed” discussion. It is a separate appropriation ($268 million in 2020/21) with explicit but broad spending parameters. This funding stream has not used updated factors since 2014/15. As a result, roughly 37 percent of the RTLBG funds are distributed based on 2010/11 factors, about 56 percent are based on 2014/15 factors, and the remaining 7 percent were legislatively driven ($10 million for Allentown SD, $6 million for Scranton SD, and $2 million for East Allegheny SD). In 2015/16 and 2019/20, Gov. Wolf proposed rolling the RTLBG into the basic education funding appropriation, but the change did not garner legislative support.
For 2020/21, policymakers temporarily paused the fair funding formula and chose to provide each school district with the same amount it received in 2019/20 given the uncertainty of the global pandemic and resulting economic crisis.
Growing Importance of Formula Factors
Each school district’s fair share of the formula-driven BEF funding equals its share of the statewide total number of weighted and adjusted average daily membership (Table 3 – row E). As more funding is distributed through the fair funding formula (Table 3 – rows A and C), the corresponding dollar value of each weighted and adjusted ADM (Table 3 – row F) increases. In other words, with more formula-distributed money, small changes in a school district’s annually updated factors, some of which tend to fluctuate, will have a greater and greater impact on a school district’s total state basic education funding.
Table 3: Basic Education Funding (BEF) Trends
($ amounts in millions) |
2014/151 |
2015/162 |
2016/173 |
2017/18 |
2018/194 |
2019/205 |
2020/216 |
| A |
Total BEF Amount |
$5,530 |
$5,695 |
$5,895 |
$5,995 |
$6,095 |
$6,255 |
$6,255 |
| B |
Base (Hold-Harmed) BEF Allocation Amount |
$5,528 |
$5,543 |
$5,542 |
$5,542 |
$5,556 |
$5,556 |
$6,255 |
| C |
BEF Fair Funding Formula Amount |
$0 |
$152 |
$352 |
$453 |
$539 |
$699 |
$0 |
| D |
% of BEF via Fair Funding Formula |
0.0% |
2.7% |
6.0% |
7.6% |
8.8% |
11.2% |
0.0% |
| E |
Total Weighted and Adjusted ADMs |
|
2,922,628 |
2,924,083 |
2,980,192 |
2,945,489 |
2,949,123 |
2,975,210 |
| F |
Value of Each Weighted & Adjusted ADM |
|
$52 |
$121 |
$152 |
$183 |
$237 |
$235 |
| G |
Value of Each W&A ADM if No Hold-Harmed |
|
$1,949 |
$2,016 |
$2,012 |
$2,069 |
$2,121 |
$2,102 |
| 1BEF Appropriation includes 2014/15 Basic Education Formula Enhancement appropriation (per Act 1A of 2016); Base amount reflects school districts' share which was less than the total amount appropriated. |
| 2Act 35 of 2016 provided a $15 million supplemental BEF appropriation for 2015/16 (allocated as base adjustments for Chester-Upland SD and Wilkinsburg SD). |
| 3Base amount changed slightly based upon prior year recalculations and audits. |
| 4Act 44 of 2017 increased the base amount for Erie City SD. |
| 5Section 2502.53(b)(iv) of the Public School Code specifies the BEF formula amount given the school district social security roll-in; base amount adjusted slightly based upon prior year recalculations and audits. |
| 6The 2020/21 distribution did not use the fair funding formula and instead established the 2019/20 allocation as a temporary base. |
In most years, a growing pie (i.e. more funding added to the BEF appropriation) masks some of the shifts in weighted and adjusted ADMs. Still, in 2018/19, 16 school districts received less state BEF funding than they had the previous year. If the formula would have been in effect for 2020/21 with no BEF increase to cover some of the ADM shifts, then 265 school districts would have lost funding compared to the previous year.
The growing financial impact of each weighted and adjusted ADM is why it is very important to have stable, yet up-to-date formula factors.
Formula Issues
“Cliffs” in the Formula – Concentrated Poverty and Sparsity Size Adjustment
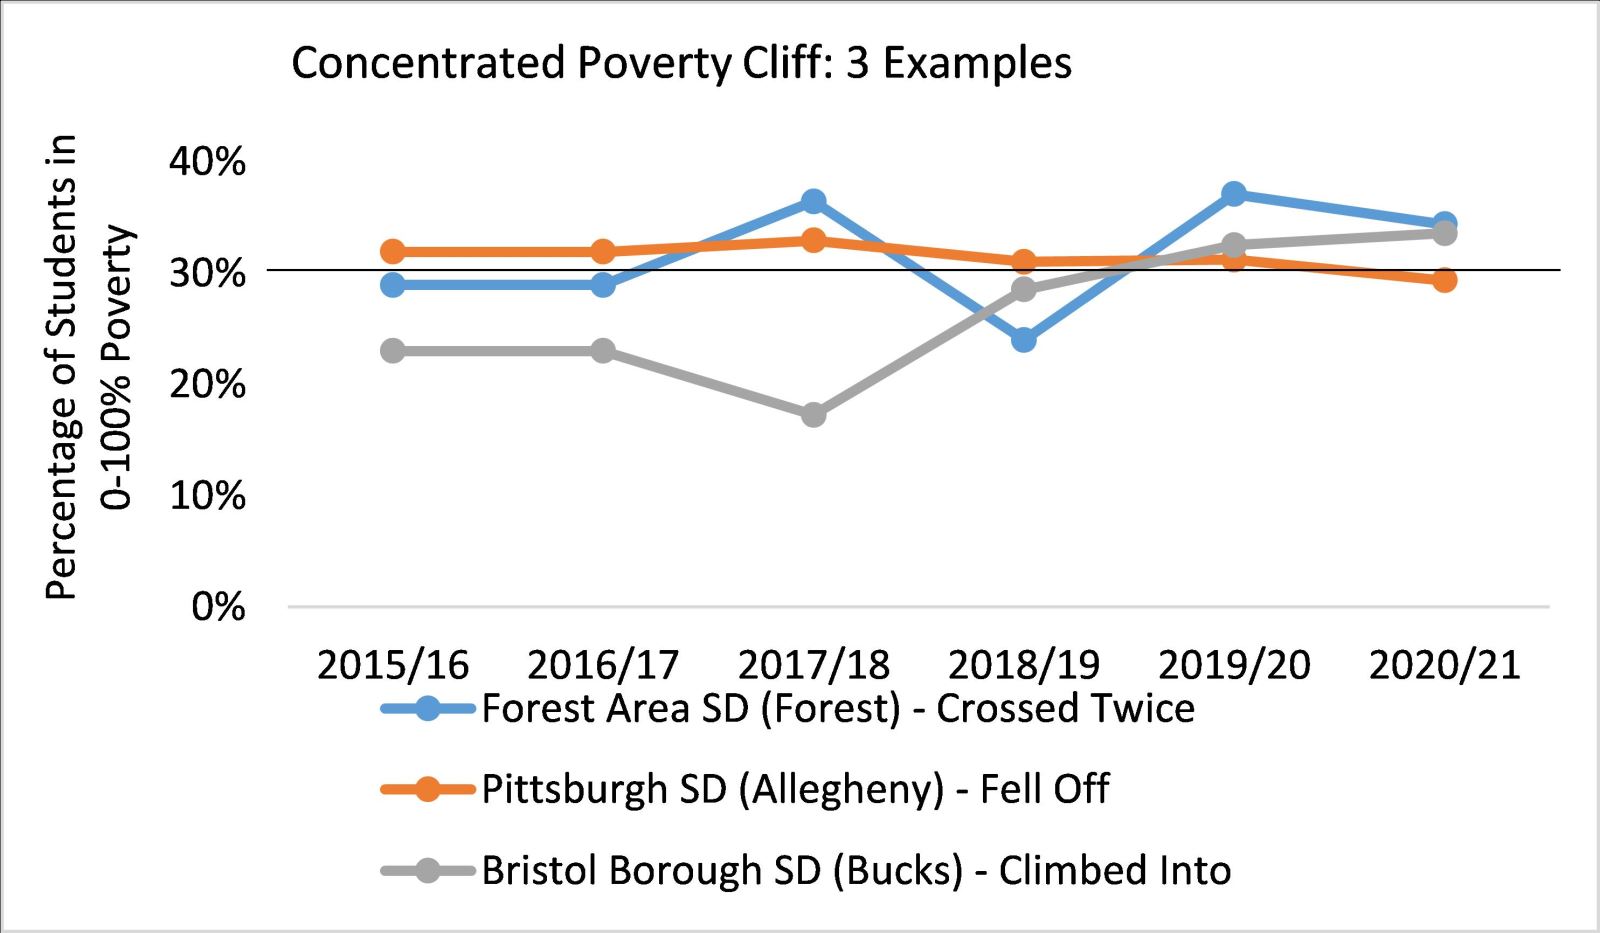
The concentrated poverty factor has a hard eligibility cut-off at 30 percent of students living in the 0-100 percent range of the federal poverty line. In other words, school districts with 29 percent concentrated poverty do not receive a benefit in the formula, while school districts with 31 percent concentrated poverty receive a boost in their fair share calculation.
The poverty factors are updated annually using Census data, and the school districts near this 30 percent cliff have found themselves on either side depending on the year (Figure 5), which causes swings and unpredictability in funding. In fact, through the first six years of the fair funding formula data, 45 school districts have been on both sides of the concentrated poverty cliff (Table 2). This phenomenon is not limited to a certain size or locale of a school district.
Figure 7
| Table 4: Through the first six years of the fair funding formula, 45 school districts have been on both sides of the concentrated poverty cliff. |
| Fell Off Concentrated Poverty Cliff |
Climbed Into Concentrated Poverty Eligibility |
Crossed Concentrated Poverty Threshold Twice |
| School District |
County |
NCES Locale |
School District |
County |
NCES Locale |
School District |
County |
NCES Locale |
| Carlynton SD |
Allegheny |
suburb |
Steel Valley SD |
Allegheny |
suburb |
Woodland Hills SD |
Allegheny |
suburb |
| Pittsburgh SD |
Allegheny |
city |
Rochester Area SD |
Beaver |
rural |
Big Beaver Falls Area SD |
Beaver |
suburb |
| Sto-Rox SD |
Allegheny |
suburb |
Bristol Borough SD |
Bucks |
suburb |
Antietam SD |
Berks |
suburb |
| Panther Valley SD |
Carbon |
rural |
Union SD |
Clarion |
rural |
Claysburg-Kimmel SD |
Blair |
rural |
| Clarion-Limestone Area SD |
Clarion |
rural |
Harmony Area SD |
Clearfield |
rural |
Clarion Area SD |
Clarion |
town |
| Albert Gallatin Area SD |
Fayette |
rural |
Steelton-Highspire SD |
Dauphin |
suburb |
Uniontown Area SD |
Fayette |
suburb |
| Connellsville Area SD |
Fayette |
rural |
Fannett-Metal SD |
Franklin |
rural |
Forest Area SD |
Forest |
rural |
| Lebanon SD |
Lebanon |
city |
Marion Center Area SD |
Indiana |
rural |
Southeastern Greene SD |
Greene |
rural |
| Greater Nanticoke Area SD |
Luzerne |
suburb |
Hanover Area SD |
Luzerne |
suburb |
Purchase Line SD |
Indiana |
rural |
| Wyoming Valley West SD |
Luzerne |
suburb |
Jamestown Area SD |
Mercer |
rural |
Mid Valley SD |
Lackawanna |
suburb |
| Oil City Area SD |
Venango |
town |
Pottstown SD |
Montgomery |
suburb |
Columbia Borough SD |
Lancaster |
suburb |
| Titusville Area SD |
Venango |
town |
Jeannette City SD |
Westmoreland |
suburb |
Hazleton Area SD |
Luzerne |
suburb |
| Monessen City SD |
Westmoreland |
suburb |
|
|
|
Mount Carmel Area SD |
Northumberland |
town |
|
|
|
|
|
|
Mahanoy Area SD |
Schuylkill |
town |
|
|
|
|
|
|
Salisbury-Elk Lick SD |
Somerset |
rural |
|
|
|
|
|
|
Shanksville-Stonycreek SD |
Somerset |
rural |
|
|
|
|
|
|
Windber Area SD |
Somerset |
suburb |
|
|
|
|
|
|
Charleroi SD |
Washington |
rural |
|
|
|
|
|
|
Washington SD |
Washington |
suburb |
|
|
|
|
|
|
Greensburg Salem SD |
Westmoreland |
suburb |
Similarly, the sparsity size adjustment factor, which recognizes the added educational costs experienced by low population density school districts, applies to school districts above the sparsity size ratio’s 70th percentile (the 150 school districts with the lowest population density). Only six school districts have been on both sides of the cliff caused by the sparsity size fixed limit: Clearfield Area SD (Clearfield), Pequea Valley SD (Lancaster), Lake-Lehman SD (Luzerne), Muncy SD (Lycoming), Mifflinburg Area SD (Union), and Western Wayne SD (Wayne).
Fluctuating Median Household Income Data
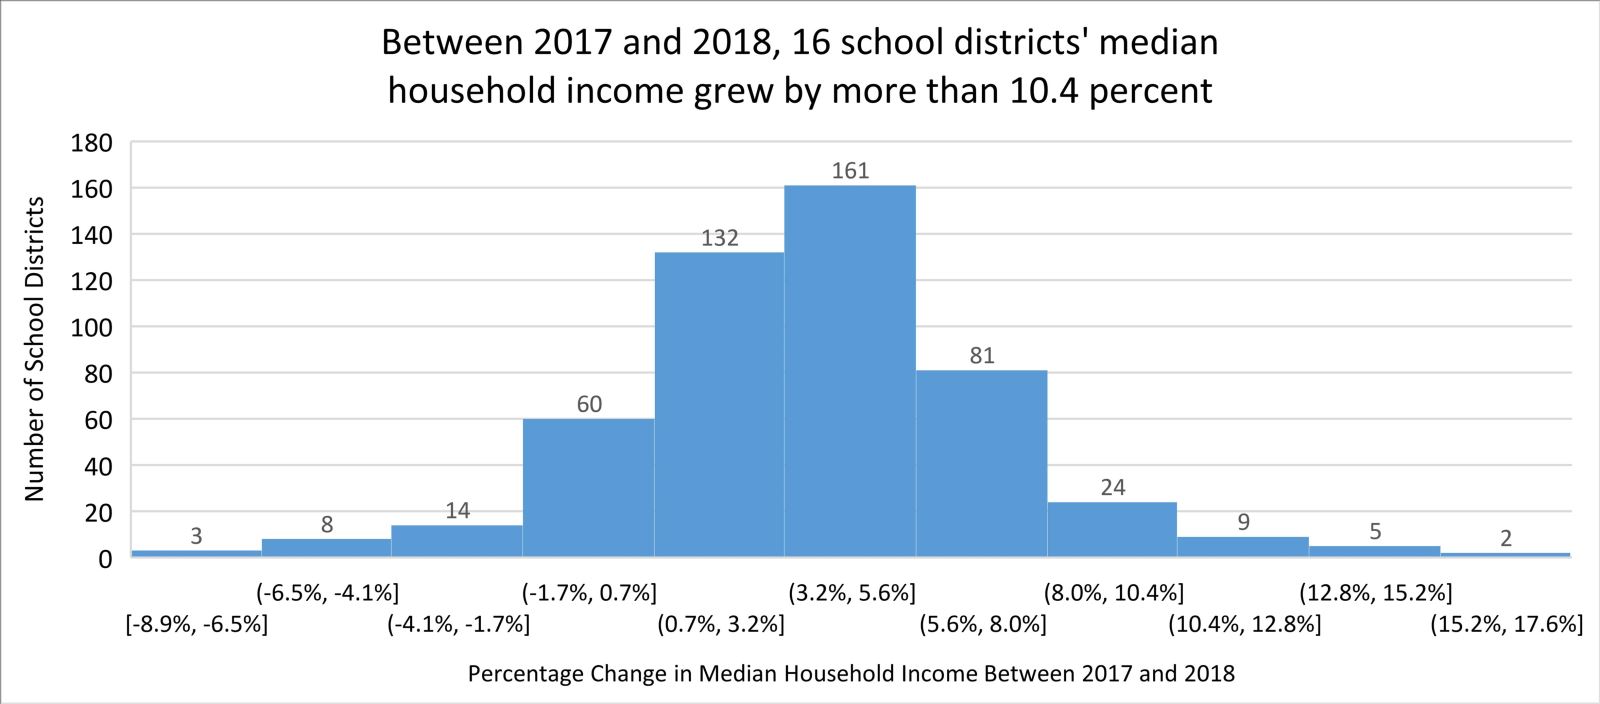
The median household income index is a multiplier in the formula, and therefore, small changes have an outsized impact on a school district’s total weighted and adjusted ADM. The data comes from the U.S. Census Bureau’s 5-year American Community Survey, which is a monthly sampling over a five-year timeframe.
For PA school districts, the median year-over-year change in the latest household income data was 3.7 percent, with a high of 17.6 percent, a low of -8.9 percent, and a standard deviation of 3.4 percent. The small number of school districts on the tails of the normal distribution pictured in Figure 8 are seeing greater swings in their share of formula-distributed funds, which erodes the stability of the formula distribution.
Figure 8
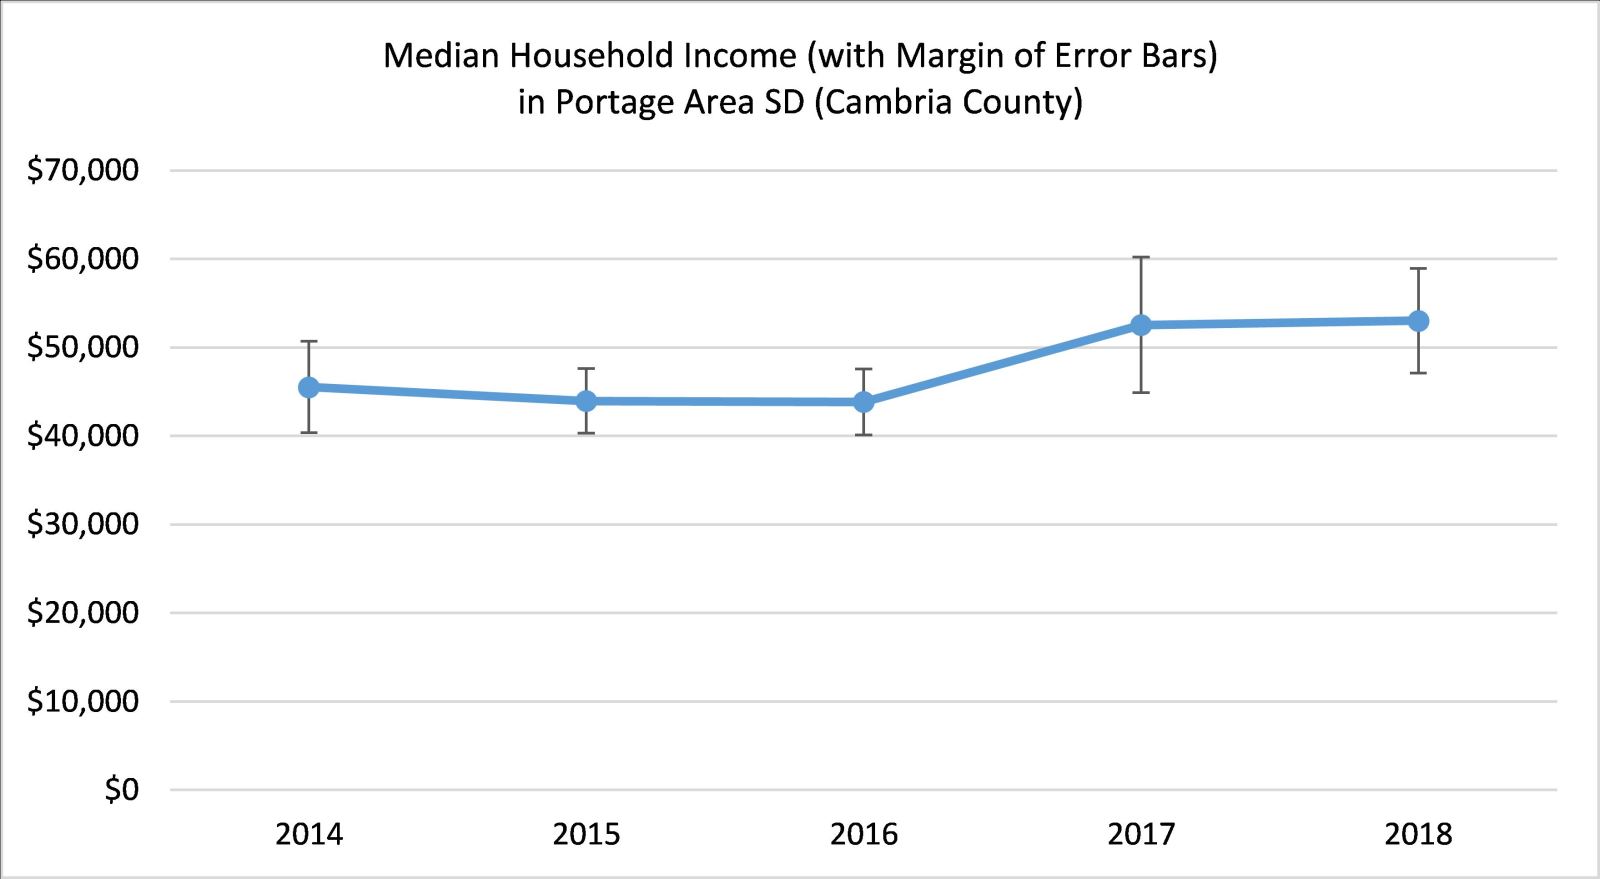
Additionally, due to the nature3 of the survey, smaller-sized school districts tend to have higher margins of error as a share of reported income. There have been isolated instances, like Portage Area SD in 2017 (Figure 9), where school districts with smaller enrollments have seen large yearly changes in median household income coupled with increasing margins of error. This invites questions about how much of the change was attributable to actual changes in the surveyed population versus sampling error. When BEFC reconstitutes, it should entertain expert testimony about how to minimize the uncertainty in the median household income data.
Figure 9
Quintile Analysis and Inequities
The BEF fair funding formula distributes funds progressively. The 100 poorest school districts in the commonwealth collectively receive 54.4 percent of the state’s fair formula-distributed funds despite being responsible for only 28 percent of the students. Conversely, the wealthiest 100 SDs educate 27.7 percent of the students, but receive just 11.5 percent of the state BEF (Figures 10 and 11).
.jpg)
.jpg)
Nevertheless, inequities persist. Pennsylvania’s 100 wealthiest school districts are spending 48 percent more per weighted student than the 100 poorest school districts. The state funding is not enough to make up for the uneven playing field. Compared to its peers, Pennsylvania’s 38.3 percent state share of education funding ranks 44th. This breeds an overreliance on local funding where huge disparities exist in the ability to raise funds. If every school district taxed itself at the statewide median tax rate, the median school district would generate $7,470 per weighted student. Meanwhile, the lowest amount raised per weighted student would be $1,154 and the highest would be $35,560.
Conclusion
The impact relevancy of the fair funding formula for basic education increased each year as more funding flowed through it. Until, that is, the legislature paused the formula for 2020/21 to lessen the unpredictability of finances during the coronavirus pandemic. Basic education funding is PA’s largest subsidy to school districts, and it is imperative to ensure that these resources are distributed predictably, accountably, transparently, and equitably. In 2022/23, BEFC is scheduled to be reconstituted to evaluate the implementation of the fair funding formula. The members of the commission will have to discuss important issues, potentially including whether “hold-harmed” is being handled in the right way, how to address the fluctuations in Census data, and the possibility of avoiding cliffs in the concentrated poverty factor.
| Table 5: Weighted ADMs |
3-year average adjusted Average Daily Membership (ADM) |
Poverty Weights |
Poverty Concentration Weight |
English Language Learner Weight |
Charter Weight |
| Rationale |
A student-based formula needs to start with an accurate count of students. A 3-year average of adjusted ADM is used to smooth out changes in enrollment, thereby allowing districts more time to make adjustments due to enrollment changes. |
“Various studies have shown that children living in poverty often begin their educational careers behind their non-impoverished peers and thus require additional supports and services in order for them to meet the same academic standards.” – BEFC Final Report, page 45 |
Research indicates that not only does a low-socioeconomic household have a negative effect on student achievement, but it also demonstrates that the socioeconomic status of the student’s community plays a large role. The negative effect that poverty has on student outcomes is compounded when the poverty is concentrated in a community. |
In addition to the regular education curriculum, Pennsylvania requires that ELL students receive language instruction, which translates into higher costs to educate ELL students (dual language curriculum material, after school programs, etc). |
When a student leaves the school district to attend a charter school, there are fixed costs (e.g. classroom, teacher) that are spread out over fewer remaining students, meaning the cost to educate the remaining students goes up. |
| Statistic |
PA’s 2019/20 statewide adjusted ADM was 1,705,292. Philadelphia City SD is by far PA’s largest district with an adjusted ADM of 203,015 or 11.9 percent of the state total with the next closest being Pittsburgh City SD with 26,438 or 1.6 percent of the total. |
“One analysis revealed that children from professional families heard an average of 2,153 words per hour, while children in working class families heard an average of 1,251 words per hour, meaning that by age four, a child from a welfare-recipient family may have heard 32 million fewer words than a classmate from a professional family.” – BEFC Final Report, page 45 |
“For example, 86 percent of students are proficient in 3rd grade reading when attending Pennsylvania districts with fewer than 25 percent of children in poverty, but only 52 percent of students are proficient in 3rd grade reading if they attend a district with 50 percent or more of their students in poverty.” – Joan Benso’s testimony at BEFC hearing December 10, 2014 |
“Research has long investigated the amount of time it takes for ELL students to obtain complete proficiency, with estimates for academic proficiency often ranging between four and seven years, while oral proficiency may be obtained in as little as three to five years.” – BEFC Final Report, page 30 |
In the IFO survey commissioned by the BEFC, the school districts that were sampled reported that, under the hypothetical scenario where 10 percent of students departed for charter schools, the average base cost to educate the remaining students increased by 18 percent. See page 84 of the BEFC Final Report. |
| Weight |
Every student counts as 1.0 except half-day kindergarten students count as 0.5 (this is how adjusted ADM differs from regular ADM which counts all students as 1). Charter school students are included in school districts' ADM. |
0.6 for acute poverty; 0.3 for poverty
Interpretation: Students in poverty are already counted as 1.0 in the ADM. The 0.6 acute poverty weight counts a student in acute poverty 1.6 times, or 60 percent higher. |
0.3 |
0.6 |
0.2 |
Definition/
Notes |
The PA Dept. of Education defines average daily membership as “the term used for all resident pupils of the school district for whom the school district is financially responsible. It is calculated by dividing the aggregate days membership for all children on active rolls by the number of days the school district is in session.” |
The acute poverty weight applies to students falling in the 0-99% range of the federal poverty level while the poverty weight factors in for students between 100-184% of the federal poverty level. |
School districts qualifying for the poverty concentration weight have over 30% of their students in the 0-99% range of the federal poverty level. |
Oftentimes also called Limited English Proficient (LEP) |
A school district pays the tuition amount (the district’s spending per student less some expenses) for its students that choose to attend a charter school. |
| Data Source(s) |
PA Department of Education |
Most recent 5-year estimate of the U.S. Census Bureau’s American Community Survey
ACS Series ID: B17024 |
Most recent 5-year estimate of the U.S. Census Bureau’s American Community Survey
ACS Series ID: B17024 |
PA Department of Education |
PA Department of Education |
| Table 6: Adjusting for District Factors |
Sparsity/Size Adjustment |
Median Household Income Index |
Local Effort Capacity Index |
Local Effort Index |
Local Capacity Index |
| Rationale |
Testimony at BEFC hearings revealed that PA school districts in rural areas have unique challenges leading to higher costs. Some examples include difficulty to consolidate services due to the geographic size of a district, extraordinary transportation challenges, and higher per-pupil costs due to a loss of economies of scale. |
A fair formula for state funding needs to account for the vastly different amounts of local wealth between districts. The MHII replaces the Market Value / Personal Income Aid Ratio as the measure of a district’s relative wealth. |
“Local tax effort and wealth are critical factors impacting the ability of school districts to raise local revenue.” – BEFC Final Report, page 40 |
The local effort index is designed to determine whether a school district is making a fair local tax effort. It compares the tax burden in each school district to the statewide median tax burden. Importantly, it includes an adjustment for school districts spending above the statewide median expenditures per weighted student so as to not reward wealthier districts that choose to have high taxes so that they may spend more per pupil. |
Asks the question, how much spending per weighted student could a district afford if it taxed at the statewide median effort?
The local capacity index component provides more state funding for districts that are unable to raise enough funds locally even if taxing at the statewide median rate. |
| Statistic |
“Specifically, when studying economies of scale in education, [researchers Baker and Levin] found per-pupil costs tend to be flat as district enrollment surpasses 2,000 students, while below this enrollment, costs tend to increase, dramatically so as enrollment dips below 500.” – BEFC Final Report, page 35 |
According to Census data, PA ranks 44th in the nation in terms of the state share of total education spending it pays for (38.3 percent). This creates gross inequities as school districts are forced to rely on drastically different local resources to pay for education.
In 2018, the median household income in PA was $59,445. |
Using 2020/21 distribution data:
PA's 100 poorest school districts based on the median household income index spent $11,010 per weighted student while the wealthiest 100 districts spent $16,295 per weighted student, or 48% more. |
Using 2020/21 distribution data:
The statewide median current expenditures per weighted student is $13,409 with a standard deviation of $2,537. |
Using 2020/21 distribution data:
If every district taxed itself at the statewide median local effort rate, the median school district would generate $7,470 per weighted student. Meanwhile, the lowest amount raised per weighted student would be $1,154 and the highest would be $35,560. |
| Adjustment Definition |
The sparsity/size adjustment weight is unique in the BEFC formula in that it is a district factor treated as a student weight. The weight is 0.7, and it applies to school districts at or above the 70th percentile of the sparsity size index. In other words, out of PA’s 500 school districts, the 150 districts with the lowest population density receive additional support. The sparsity/size adjustment is part of the weighted student count. The special education formula uses the same sparsity/size ratio. |
The MHII measures a school district’s median household income compared to the statewide median household income. The higher the MHII, the less income a school district has. The weighted student count is multiplied by the MHII in the formula. This means a MHII value greater than 1 increases a school district’s share of the funding, while a value below 1 decreases a school district’s share of the funding. |
The Local Effort Capacity Index is the sum of the Local Effort Index and the Local Capacity Index. In the BEFC formula, the Local Effort Capacity Index is multiplied by the weighted student count. This means an index value greater than 1 increases a school district's share of funding, while a value below 1 decreases a school district's share of the funding. |
The local effort index is added to the local capacity index in the BEFC formula. The stronger the local effort is (after accounting for spending above the median), the higher the index value will be. |
If the district's capacity to raise local funds is lower than the statewide median capacity, the district's local capacity index is above zero. If higher, the index is zero. The local capacity index is added to the local effort index in the BEFC formula. |
| Data Source(s) |
PA Department of Education - for adjusted ADM
U.S. Census Bureau's latest decennial census - for Total Square Miles |
Most recent 5-year estimate of the U.S. Census Bureau’s American Community Survey
ACS Series ID: S1903 |
Most recent 5-year estimate of the U.S. Census Bureau’s American Community Survey - for median income - ACS Series ID: S1903
PA Department of Education - for local tax related revenue, current expenditures, adj. ADM, and state property tax reduction allocation
PA Department of Community and Economic Development's Tax Equalization Division - for market values and adjusted personal income (reported to PDE) |