General Fund Revenue Update - September 2020
By Eric Dice , Assistant Executive Director | 3 years ago
Monthly Revenue Analyst: Brittany Van Strien, Budget Analyst
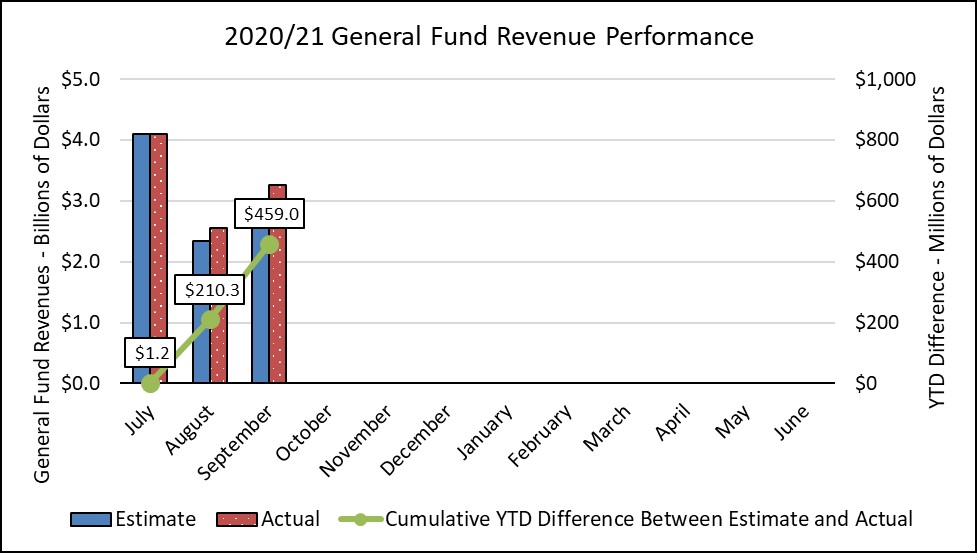
September’s General Fund collections were $248.7 million higher than the official revenue estimate. Year-to-date, revenues are now $459.0 million higher than expected. While a significant budgetary gap will still exist, if revenues continue their current path, it could help close a portion of the commonwealth’s major budgetary gap that must be addressed by November 30.
Sales tax receipts were well above estimate, with non-motor collections $57.1 million above estimate and motor vehicle sales tax collections $33.5 million higher than expected. The increased consumer activity even in the midst of high unemployment may point toward pent-up demand from the spring and early summer.
Personal income tax withholdings were $55.4 million above estimate. Like the sales tax, employer withholdings from wages and salaries are recurring each month, which is encouraging.
PIT quarterly estimated payments, however, were not positive, falling short of the official estimate by $40.0 million, or 9.2 percent. This month’s payments were $47.3 million lower or 10.8 percent than the September 2019 payment. Lower than expected quarterly estimated payments can impact the Q4 estimated payment in January, and the final payments in April for the 2020 tax year.
Corporate net income taxpayers remitted quarterly estimated payments in September as well, but unlike the PIT, CNIT estimated payments were $95.5 million higher than estimate, or 25.6 percent. While higher than the official estimate, these payments were still 5.1 percent lower than the CNIT estimated payments made last September.
For the month of September, total General Fund revenues were $248.7 million higher than expected, or 8.3 percent.
- Corporate net income tax collections were $120.9 million higher than expected (25.5 percent)
- Quarterly estimated CNIT payments were $95.5 million more than anticipated (25.6 percent)
- Final CNIT payments were $25.5 million above estimate (25.2 percent)
- Sales and use tax collections were $90.7 million higher than expected (10.0 percent)
- Non-motor sales tax collections were $57.1 million more than estimate (7.3 percent)
- Motor vehicle sales tax collections were $33.5 million above projections (26.7 percent)
- Personal income tax revenues were $19.5 million more than the official estimate (1.5 percent)
- Employer withholdings on wages and salaries were $55.4 million more than anticipated (6.5 percent)
- Quarterly estimated payments were $40.0 below estimate (9.2 percent)
- Final payments were $4.1 million more than projected (12.3 percent)
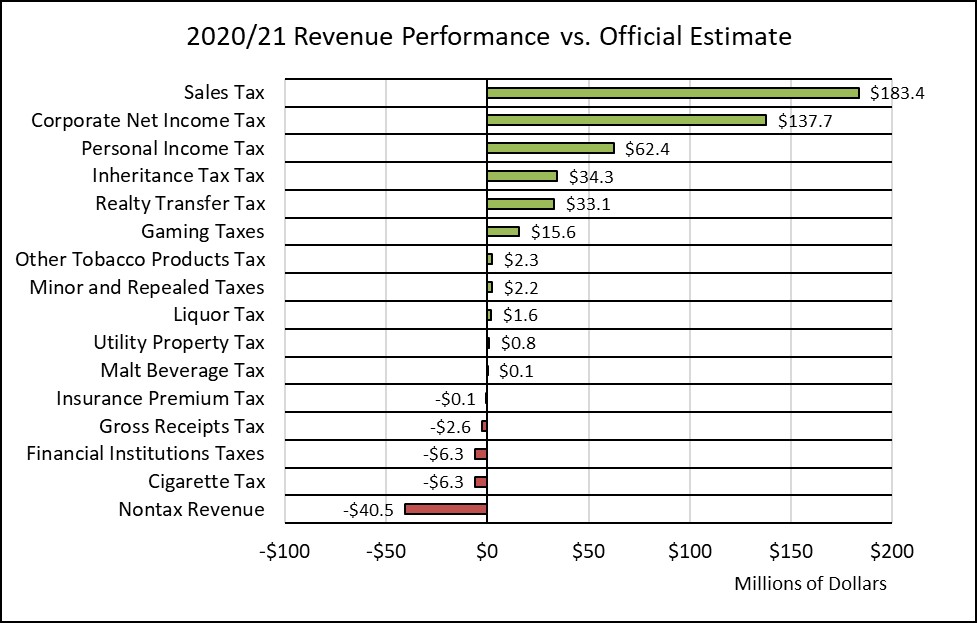
- Realty transfer tax collections were $18.8 million more than expected (54.2 percent)
- Inheritance tax collections were $28.5 million higher than anticipated (40.9 percent)
- Gaming tax receipts into the General Fund were $9.6 million higher than projected (120.3 percent)
- Non-tax revenues for May were $35.0 million less than expected (64.1 percent), mostly due to lower than expected escheats revenue.
Through the first quarter of the 2020/21 fiscal year:
- Cumulative General Fund revenues are $459.0 million higher than expected (4.9 percent)
- General Fund tax revenues are $499.5 million higher than projected (5.3 percent)
- Corporate net income tax revenues are $137.7 million more than expected (14.0 percent)
- Sales and use taxes are $183.4 million more than expected (5.9 percent)
- Personal income tax collections are $62.4 million higher than anticipated (1.4 percent)
- Non-tax revenues are $40.5 million below the estimate (42.7 percent)
|
General Fund Revenues - Year-to-Date Performance vs Official Estimate
|
|
Amounts in Millions
|
YTD Estimate
|
YTD Collections
|
Difference
|
|
General Fund Total
|
9,455.1
|
9,914.1
|
459.0
|
|
Tax Revenue Total
|
9,360.2
|
9,859.7
|
499.5
|
|
Corporation Taxes
|
1,008.4
|
1,141.1
|
132.7
|
|
Corporate Net Income Tax
|
980.4
|
1,118.1
|
137.7
|
|
Gross Receipts Tax
|
10.3
|
7.7
|
(2.6)
|
|
Utility Property Tax
|
1.1
|
1.9
|
0.8
|
|
Insurance Premiums Taxes
|
1.3
|
1.2
|
(0.1)
|
|
Financial Institutions Taxes
|
15.3
|
9.0
|
(6.3)
|
|
Consumption Taxes
|
3,483.5
|
3,702.7
|
219.2
|
|
Sales and Use Tax
|
3,099.2
|
3,282.6
|
183.4
|
|
Cigarette Tax
|
252.0
|
283.9
|
31.9
|
|
Other Tobacco Products
|
31.2
|
33.5
|
2.3
|
|
Malt Beverage Tax
|
6.3
|
6.4
|
0.1
|
|
Liquor Tax
|
94.8
|
96.4
|
1.6
|
|
Other Taxes
|
4,868.3
|
5,015.9
|
147.6
|
|
Personal Income Tax
|
4,459.4
|
4,521.8
|
62.4
|
|
Realty Transfer Tax
|
94.7
|
127.8
|
33.1
|
|
Inheritance Tax
|
274.2
|
308.5
|
34.3
|
|
Gaming
|
28.4
|
44.0
|
15.6
|
|
Minor and Repealed
|
11.6
|
13.8
|
2.2
|
|
Non-Tax Revenue
|
94.9
|
54.4
|
(40.5)
|